
RESEARCH ARTICLE
Intelligent Approach for Analysis of Respiratory Signals and Oxygen Saturation in the Sleep Apnea/Hypopnea Syndrome
Vicente Moret-Bonillo*, 1, 2, Diego Alvarez-Estévez 1, Angel Fernández-Leal 1, Elena Hernández-Pereira 1
Article Information
Identifiers and Pagination:
Year: 2014Volume: 8
First Page: 1
Last Page: 19
Publisher Id: TOMINFOJ-8-1
DOI: 10.2174/1874431101408010001
Article History:
Received Date: 22/12/2013Revision Received Date: 25/2/2014
Acceptance Date: 28/2/2014
Electronic publication date: 13/6/2014
Collection year: 2014
open-access license: This is an open access article licensed under the terms of the Creative Commons Attribution Non-Commercial License (http://creativecommons.org/licenses/by-nc/3.0/) which permits unrestricted, non-commercial use, distribution and reproduction in any medium, provided the work is properly cited.
Abstract
This work deals with the development of an intelligent approach for clinical decision making in the diagnosis of the Sleep Apnea/Hypopnea Syndrome, SAHS, from the analysis of respiratory signals and oxygen saturation in arterial blood, SaO2. In order to accomplish the task the proposed approach makes use of different artificial intelligence techniques and reasoning processes being able to deal with imprecise data. These reasoning processes are based on fuzzy logic and on temporal analysis of the information. The developed approach also takes into account the possibility of artifacts in the monitored signals. Detection and characterization of signal artifacts allows detection of false positives. Identification of relevant diagnostic patterns and temporal correlation of events is performed through the implementation of temporal constraints.
1. INTRODUCTION
The Sleep Apnea-Hypopnea Syndrome (SAHS) is a syndrome which is characterized by the occurrence of repetitive episodes of total or partial reduction in patient’s respiration during sleep. These pauses are usually accompanied by a drop in the oxygen saturation levels which are proportional to the reduction in airflow. One of the main problems of this disease is that patients are usually unaware of their own symptoms, and most of them are currently underdiagnosed. The actual prevalence has been estimated to be between 2%-4% of the general population. In 1983 Guilleminault et al. [1] described cardiac arrhythmias and behavior disorders related to SAHS. This description was followed by several reports searching for cardiac arrhythmia, hypertension, cerebrovascular accidents and sudden death as sequels of SAHS. Nowadays SAHS is associated with an increasing risk of suffering cardiac and cerebral infarct, high arterial pressure, arrhythmias, and in general, several dysfunctions of the cardiorespiratory system [2-5]. Patients suffering from sleep apnea present involuntary respiratory pauses that repeats throughout the night (i.e. Apneic Events). The duration of these pauses is variable and depends on the particular patient. Typical duration is about 20 to 40 seconds. There are two types of apneic events. In a broad sense HYPOPNEA is defined as a respiratory pause meeting the duration criteria with an associated reduction around 30%-40% respect to baseline breathing flow. In the case of anAPNEA the associated reduction is more pronounced, usually between 90% reduction and total breathing cessation.
Apneic events also can be classified according to the nature of the underlying physiological cause. Three types of apneic events can be differentiated in this respect: obstructive, central and mixed. Description of related apneic events is given below [6].
Obstructive Apnea: Origin of the apneic event is found in the partial or total obstruction of the upper airways. An increase in respiratory effort of the patient can be observed as a consequence of the obstruction. Frequently such effort eventually causes the unconscious awakening of the patient. Detection of obstructive apneic events is carried out by examining the context of the apneic event searching for signs of presence of respiratory effort.
Central Apnea: In this case the respiratory pause is normally due to neurological alterations that cause temporal loss of respiratory efforts. Detection of central events is based on the examination of respiratory movements to assess the presence or absence of respiratory effort. In this case both thoracic and abdominal signals show evidence of no respiratory effort.
Mixed Apnea: Mixed events appear as a combination between central and obstructive events. Normally the event starts as central and subsequently an obstructive respiratory effort is produced.
In this work the authors describe an intelligent approach as a helping tool for clinical decision making in the diagnosis of SAHS. The approach is based on the analysis of respiratory signals (airflow and both abdominal and thoracic movements) and oxygen saturation in arterial blood, SaO2. The proposed approach makes use of different artificial intelligence techniques and reasoning processes capable of dealing with imprecise data. Such procedures are based on fuzzy logic and on temporal analysis of the information. The developed approach also takes into account the possibility of artifacts in the monitored signals. Detection and characterization of signal artifacts allows identification of false positives. Inference of relevant diagnostic patterns and temporal correlation of events is achieved through the implementation of temporal constraints. The goal is to form significant diagnostic patterns to identify recording intervals where evidence points out to the existence of apneic episodes [7].
2. METHODS
Analysis of the respiratory signals involves analysis of airflow and abdominal and thoracic excursions for the detection and quantification of respiratory pauses. These pauses are characterized by intervals with amplitude reductions with respect to the normal respiration. On the other hand analysis of arterial blood oxygen saturation signal, SaO2, is performed in order to detect and quantify de-saturation and re-saturation intervals indicative of the presence of apneic events. Main objective is localization of specific apneic evidences in the respiratory activity of the patient to be correlated in time forming diagnostic patterns.
2.1. Preprocessing of Signals
A first preprocessing analysis is carried out to search for artifacts in the monitored signals. Two kinds of artifacts are intended to be detected: (a) those caused by bad calibration of the sensors (overflow artifacts), and (b) those caused by signal interruptions (loss of focus).
Digital representation of overflow artifacts results in a signal that appears saturated within its dynamic range. Overflow artifacts often occur in respiratory airflow or in the respiratory movement signals (either abdominal or thoracic). On the other hand when a loss of focus occurs the normal trend of the signal suddenly interrupts. In any case detection of both situations should be performed before the application of further analysis algorithms. The proposed approach for artifact management is as follows:
- First, potential artifacts are highlighted in the corresponding signal. This is performed marking the starting and ending points of the suspected artifact. Thus a list of artifact intervals detected in the monitored signals is obtained. Additionally a classification of artifact’s severity is performed according to its duration in the context of the corresponding signal.
- Second, a reconstruction of the signal process is carried out. This is important in the case of a loss of focus since application of filter algorithms can introduce fictitious frequencies in the range of the affected signal.
For confirmation of overflow artifacts the system checks whether or not the signal under consideration reaches the limits of its dynamic range. Signal period is then calculated and if the overflow interval exceeds the period of the signal then an artifact is marked. On the other hand, detection of loss of focus in the saturation signal is performed by differentiation, marking as artifacts those signal intervals in which derivative surpasses a given threshold value which is considered biologically possible. Values surpassing such value are considered abrupt shifts in the signal caused by non natural biological transitions and are thus spurious behaviors of the signal.
Once detected, classification of artifacts is based on two lower and upper limit values, namely Lmin and Lcritical. Lmin is used in the case of overflow artifacts. In this respect only overflow intervals with duration higher than signal period are considered as artifacts. Once detected, artifacts can be of two types: Weak Artifacts (WA) or Heavy Artifacts (HA). From Lmin and while interval duration is less than Lcritical the artifacts is classified as WA. Durations higher of Lcritical are marked as HA. Fig. (1) shows an example of such classification in the saturation signal.
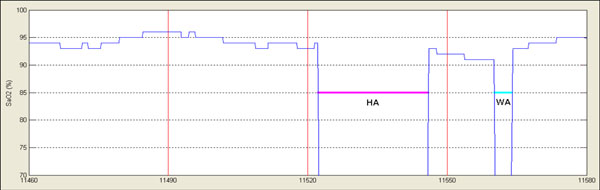 |
Fig. (1). In the Fig. two different artifacts have been detected and classified according to their duration: HA = Heavy Artifact, WA = Weak Artifact. |
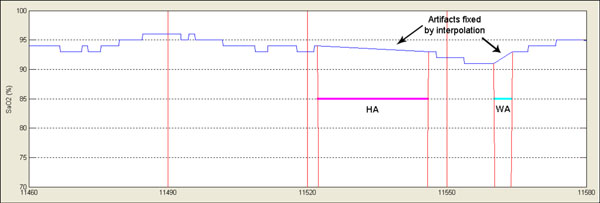 |
Fig. (2). Signal has been reconstructed by interpolation of extreme values. |
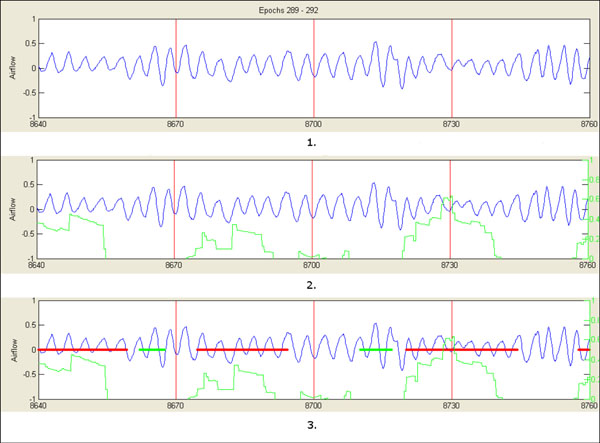 |
Fig. (3). Detection of apneic intervals: (1) original airflow signal; (2) computed reduction signal added in green; (3) apneic intervals marked in red, intervals marked in green represent respiration recovering periods. |
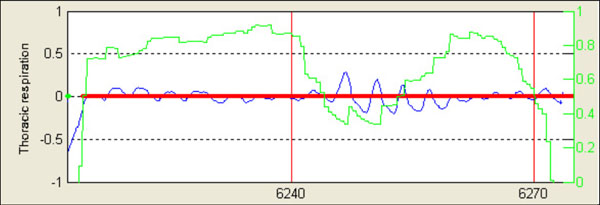 |
Fig. (4). Original apneic interval after initial processing algorithm. |
 |
Fig. (5). Same event as in Fig. (4), average associated reduction is shown with a black dotted line. |
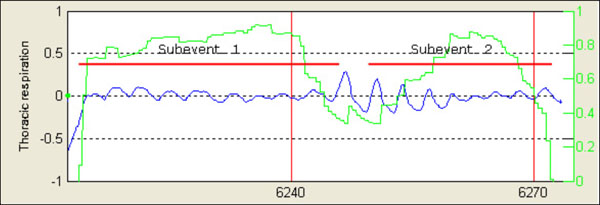 |
Fig. (6). Same event as in Fig. (4), finally original event is split and two different apneic intervals are obtained. |
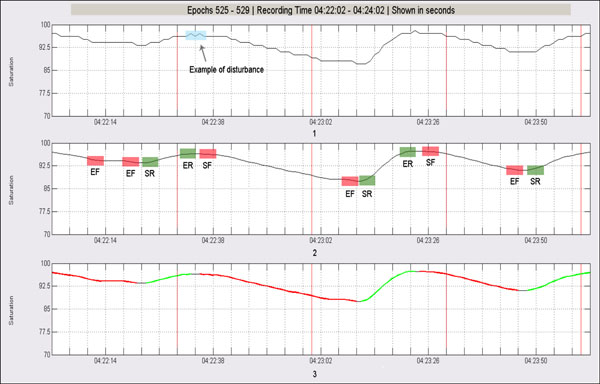 |
Fig. (7). Analysis of SaO2 signal. (1) Original signal: a disruption on the signal is highlighted.(2) Smoothed signal where patterns start of fall (SF), end of fall (EF), start of rise (SR) and end of rise (ER) have been detected. (3) Original signal has been segmented according to possible desaturation (red) and resaturation events (green). |
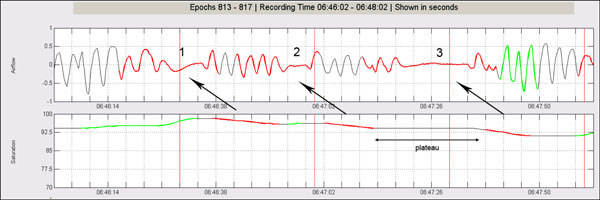 |
Fig. (8). Three consecutive apneic events can be observed in a short period of time. However, despite two individual events can be observed on the airflow, no resaturation at all is observed between the second and the third apneic event. |
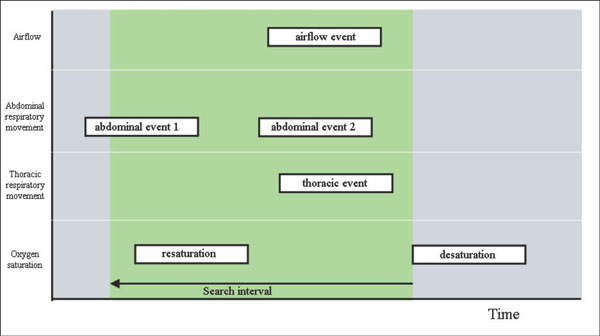 |
Fig. (9). Definition of the search interval in the apneic pattern correlation. |
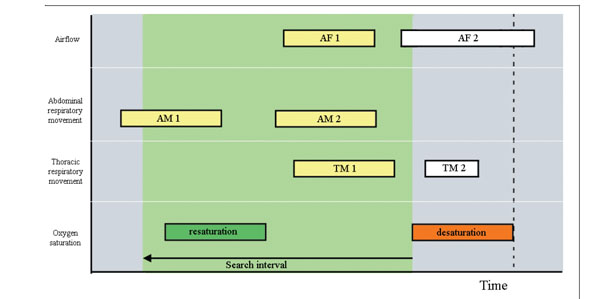 |
Fig. (10). Correlation of apneic patterns: event AF2 does not correlate because its end overpasses ending point of the saturation fall. Event TM2 also does not correlate because it starts after starting point of desaturation. AF = Airflow; AM = Abdominal Movement; TM = Thoracic Movement. |
 |
Fig. (11). Correlation of apneic patterns: event TM1 does not correlate because it ends before starting of resaturation pattern. AF = Airflow; AM = Abdominal Movement; TM = Thoracic Movement. |
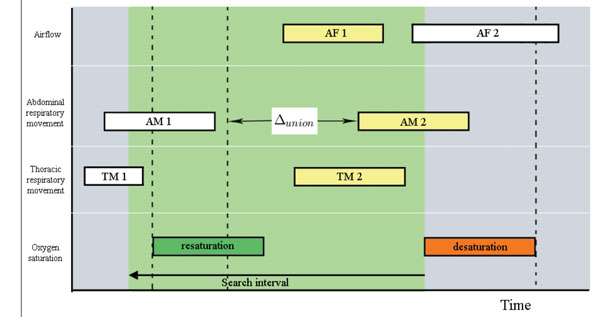 |
Fig. (12). Correlation of apneic patterns: Event AM1 is discarded for correlation since its distance to AM2 is higher than Δunion. AF = Airflow; AM = Abdominal Movement; TM = Thoracic Movement. |
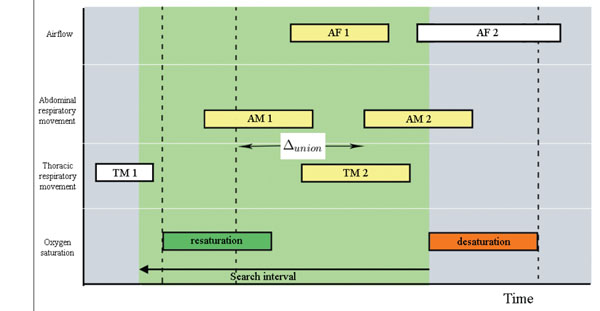 |
Fig. (13). Correlation of apneic patterns: Distance between events AM1 and AM2 is less than Δunion. AF = Airflow; AM = Abdominal Movement; TM = Thoracic Movement. |
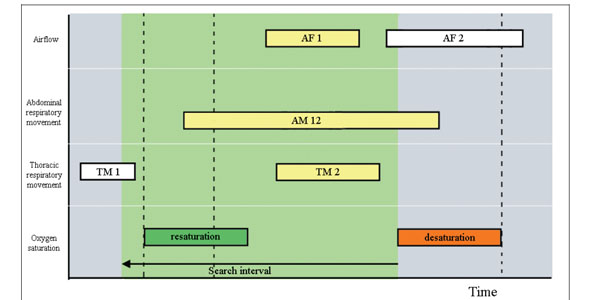 |
Fig. (14). Correlation of apneic patterns: Events AM1 and AM2 are merged to form a new event AM12. Events marked in yellow are those that finally form the apneic pattern together associated with the desaturation. AF = Airflow; AM = Abdominal Movement; TM = Thoracic Movement. |
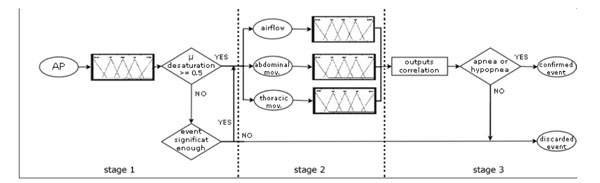 |
Fig. (15). Fuzzy reasoning schema split into three stages. AP = apneic pattern; mov = movement. |
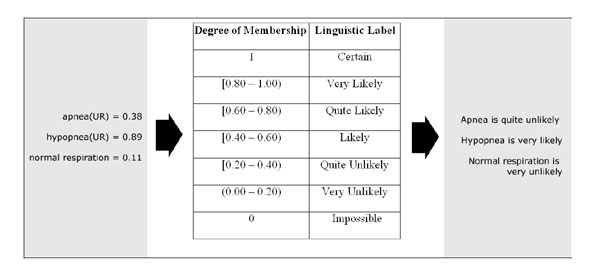 |
Fig. (16). Outputs in the form of linguistic labels for the differing degrees of membership. |
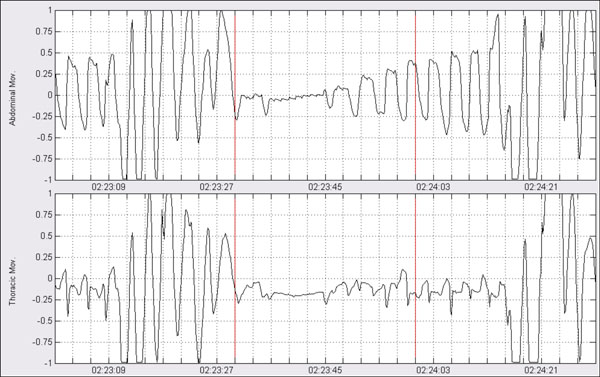 |
Fig. (17). Classification processing: Apneic event shown over abdominal and thoracic respiratory movements. |
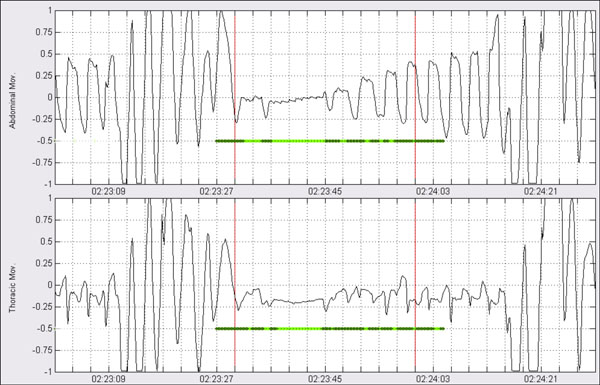 |
Fig. (18). Classification processing: segmentation has been made according to periods of presence of movement (dark green) and absence of movement (light green). |
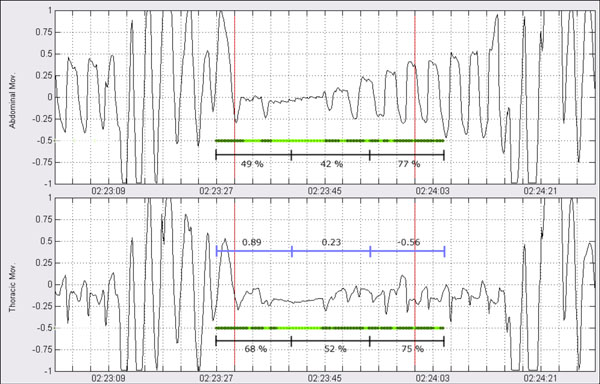 |
Fig. (19). Classification processing: Each derivation is divided into three intervals and amount of presence of movement is computed. Percentages are shown below marks of previous segmentation. Linear correlation between the two signals is also computed for each subinterval. Resulting correlation is shown in the middle of the figure. |
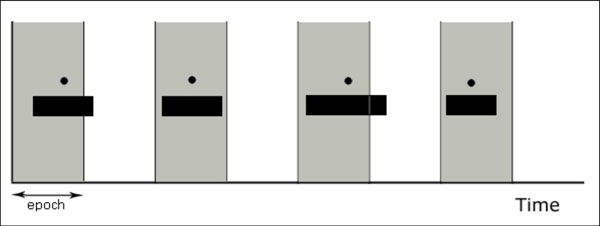 |
Fig. (20). Each black rectangle represents an apneic event over a time scale (the x axis). The circles represent the mid-points that locate apneic events unequivocally in an epoch (in grey). |
Occurrence of an HA is considered serious enough to invalidate reasoning analysis results. This is because the presence of an HA artifact implies a significant loss of information and thus the apneic episode eventually detected should be discarded.
In the case of a loss of focus signal reconstruction is accomplished, when possible, in order to minimize collateral effects on the analysis phases. Application of digital filters for example may introduce artificial values as a consequence of the abrupt shifts in the natural signal evolution. In these cases linear interpolation between immediately adjacent samples free of artifact is performed and resulting signal is assumed to follow normal signal evolution as if the artifact were not present. Fig. (2) shows reconstruction of the signal shown in Fig. (1). Signal trend previous to reconstruction as well as information about classification of the artifact are maintained.
2.2. Identification of Apneic Intervals
Detection of apneic intervals involves analysis of airflow and movement signals from thoracic and abdominal excursions. All of them follow a sinusoidal pattern. The period of such signals represent the respiratory rhythm and their input configuration amplitude is always normalized to [-1, +1].
The signal that constitutes the focus of reference for the localization of apneic events within the classical clinical approach is the “airflow”. However signals of respiratory movements also produce a measure of the amount of respiration since each inspiratory/expiratory cycle causes an increment/decrement in the thoraco-abdominal section.
Algorithms developed for the detection of apneic intervals–amplitude reductions- perform in the same manner over these three signals. Taking into account classical definition regarding apnea and hypopnea events, their minimal duration is established to 10 seconds. However, in order to avoid crisp classification, it may be interesting to detect significant amplitude reductions of shorter duration. In this manner the detection criterion is relaxed introducing a first source of imprecision in the system. The designed detection algorithm searching for apneic intervals in the three considered signals works as follows:
- Processing of the three signals is carried out through by shifting a temporal moving window of length Δevent seconds so that each sample (i) is associated to the temporal window that starts in the i-th sample. Maximum signal amplitude within the window Ωevent(i) is then calculated as the difference between the maximum and minimum signals values contained in the corresponding window. Thus value ∆event defines minimal duration of the possible amplitude reduction associated to an apneic interval.
- Computed Ωevent(i) amplitude is compared with respect to baseline value calculated over the immediately corresponding previous interval of duration, that is: ∆baseline seconds. Duration of this comparison interval, usually established to 2 minutes, is used to determine the amplitude value of normal respiration. It is important to remark that within the baseline interval only periods of stable respiratory amplitude are considered. Previous periods marked as possible apneic intervals are not taken into account to compute amplitude value for the baseline breathing. Resulting amplitude reference Ωbaseline is calculated by averaging the Ωevent(k) amplitudes associated with the corresponding temporal windows of the k-th samples within the baseline period. Thus, Ωbaseline(i) represents amplitude value of normal respiration for the current sample under analysis (i) that is associated with amplitude Ωevent(i).
- Comparison of amplitude associated the current sample with its corresponding baseline value leads to a new measure α representing associated reduction:
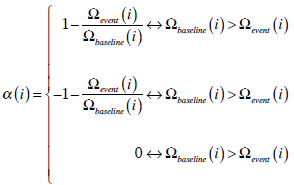
By repeating this process throughout all samples of the three signals, a new reduction signal is obtained that increases in the intervals where signal amplitude decreases with respect to baseline respiration, and decreases when respiration recovers. - From the previous obtained signal, those periods in which associated reduction is higher than αmin and have duration more than Δmin seconds are considered as possible apneic intervals. Duration Δmin marks minimal duration of detectable apneic event by the system, thus Δmin ≥ Δevent. Both αmin and Δmin are configurable values and default values have been empirically established to 10% and 8 seconds respectively. Note that according to the dynamical range of the raw signals (contained in [-1, +1]) a ±10% amplitude change corresponds to a difference of ±0.1 in the signal α(i).
The overall process is illustrated in Fig. (3).
As a last subtask, a post-processing is performed over the previously detected apneic intervals. The post-processing has as its objective the tuning of the results of the detection algorithm. The procedure is described subsequently:
- For those apneic intervals with duration more than established Δmax seconds, average associated reduction average is calculated (Fig. 4).
- Suspicious event is segmented according to periods in which associated reduction signal exceeds average cut (Fig. 5).
- Segmented intervals of duration more than Δmin are finally considered as individual apneic intervals and are definitively separated from the original event (Fig. 6).
2.3. Characterization of Oxygen Saturation Signal
During the occurrence of an apneic event, and as a consequence of the airflow reduction during inspiration, a reduction of oxygen concentration in arterial blood oxyhemoglobin is produced. Thus, it is said that an oxygen desaturation is occurring. When airflow recovers oxygen concentration is quickly restored leading consequently to resaturation in the SaO2 signal [8].
Normally desaturation in SaO2 signal can be detected within an interval of 20-40 seconds after the causing apneic event initiates. Duration of desaturation should be more than 10 seconds and the relative decrease in the saturation levels with respect to normal respiration is about 2-4%. The lowest saturation level may be maintained for some seconds – desaturation plateau. Then, oxygen concentration raises until recovering preceding levels of stable breathing. Because of the hyperventilatory compensation produced as a consequence of the fall in the oxygen levels in blood, resaturation event often is produced in a more abrupt form when compared to desaturation. In fact, resaturation events rarely last more than 10 seconds. Processing algorithm of SaO2 signal works as follows (Fig. 7):
- Signal preprocessing is performed by using a means filter in order to remove little disturbances that may interfere in subsequent analysis stages. In this regard convolution of the signal with the filter is made using a 5 seconds temporal window.
- Once the signal has been filtered, if sampling rate is higher than 1 Hz then a downsampling is applied up to work with one sample per second. Then, a new temporal window of 5 samples is shifted throughout the resulting signal sample by sample. This window is centered on the current sample and the difference between the corresponding second previous and second subsequent samples is computed. That is, let n to be the current sample, difference calculation is carried out as follows:
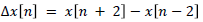
where x[n] is the value of the saturation signal which corresponds to sample n. From this new processed signal, and by means of a new differentiation, the points representing patterns of the type start of fall, end of fall, start of rise and end of rise are marked. - Finally SaO2 is segmented according to previous detected patterns. In this respect a possible desaturation results from the chaining of one or more start of fall patterns followed by one or more end of fall patterns, which mark a complete fall. Analogously a possible resaturation results from the chaining of one or more start of rise patterns followed by one or more end of rise patterns, which represents a complete rise.
Sometimes happens that subsequent chaining of several ends of fall patterns with no intermediate resaturations produce abnormally long desaturation intervals. In these cases resulting possible desaturations usually present an intermediate plateau that connects two or more subsequent falling intervals. When this plateau is excessively long it does not have sense anymore to consider that the flat period pertains to the same physiological event. A more plausible explanation is the occurrence of two independent desaturation events in which no significant resaturation is observed between them. To deal with this possibility, when suspiciously long falling saturation intervals are detected (>30 seconds), further analysis is performed trying to localize intermediate plateau subintervals. In the case a flat stable subinterval (>15 seconds) is detected within the suspicious event, then plateau subinterval is removed and two independent falling intervals are computed (Fig. 8).
2.4. Integration and Event Characterization
Temporal constraint rules are applied to characterize intervals in the recording in which there is evidence pointing out to the possible existence of an apneic event. Resulting apneic patterns are then evaluated by means of a reasoning process in which context information is taken into account to classify the pattern as either apneic or false positive. In this respect a fuzzy inference system is used to obtain degrees of membership with respect to categories of apnea, hypopnea of false positive. The set of apneic patterns that have been considered true positives are then classified (i.e. central, obstructive or mixed) by similar fuzzy classification techniques. Previous to classification, additional analysis of thoracoabdominal derivations is necessary to evaluate presence or absence of respiratory effort. These three outlined processes are subsequently described in more detail.
Temporal Event Correlation. Time correlation of the individual events is carried out by applying a series of temporal constraints that determine how the different events should be inter-related to be considered as a relevant diagnostic pattern. A first level of temporal constraints involves the respiratory events located in the signals “airflow”, SaO2, “thoracic movements” and “abdominal movements”. Each one of the resulting patterns defines a reasoning unit in our approach which is subsequently interpreted. The main hypotesis is as follows: Existence of an apneic pattern is considered when the underlying cause has physiological significance. This hypothesis will guide the correlation process. In this regard, when a respiratory pause occurs as a consequence of an apneic event, the pause is reflected in the sinusoidal signals that monitor the respiratory cycles, as an amplitude reduction interval-apneic interval- with respect to normal breathing. On the other hand, as a consequence of the drop in the respiratory flow, oxygen saturation levels in arterial blood decay producing a desaturation. Desaturation normally can be seen with a certain lag with respect to occurrence of the apneic intervals. Once the apneic event ends, amplitude recovering can be seen usually with presence of compensatory hyperventilation- amplitude recovering slightly higher than previous baseline breathing - as well as resaturation in oxygen levels, again with a certain delay with respect to end of the apneic intervals.
Having the previous sequence of physiological events, the temporal correlation process tries to establish the corresponding relations among the respiratory events detected through the above set of signals. During this process desaturation events detected in the oxygen saturation signal are taken as the initial reference. In this respect, for each possible desaturation previously detected in the SaO2 signal:
- A searching interval is defined starting at the end of the desaturation. This temporal window has duration of 30 seconds defining a time interval for the localization of apneic intervals in signals of airflow and thoracoabdominal respiratory movements (Fig. 9).
- Within the searching interval we consider for correlation those events fitting the interval. Events exceeding the ending point of the saturation fall are not considered, even if they partially overlap the searching interval (Fig. 10).
- If a rising interval exists in the saturation signal-sign of a possible resaturation-within the searching interval, those events ending before starting of the rise are not considered as well (Fig. 11).
- For the remaining events within the searching interval, and for each one of the three signals of airflow, abdominal movement and thoracic movement: (a) Starting from the beginning of desaturation and going back in time, the algorithm searches the closer event. This event is related with the possible desaturation, and (b) If more than one event have been identified they are considered as an unique event if (and only if) temporal difference between respective ending and starting points is less than Δunion seconds, and a respiratory recovering has not been detected between them (Fig. 12-14).
After this temporal correlation process, and for each rise/fall pattern detected in the SaO2 signal, an apneic pattern is obtained representing the occurrence of a possible apneic event.
Detection of Apneic Events: It is at this stage where imprecise reasoning takes place through the use of a fuzzy inference system. In this respect, input information considers all the apneic patterns detected at the previous step. All this information is of uncertain nature since there is not an exact threshold value that determines the precise evaluation of each one of these evidences.
Each apneic pattern is analyzed as illustrated in Fig. (15). Knowledge is structured in several knowledge bases composed of fuzzy rules that evaluate the information at different levels of abstraction.
The reasoning process takes place in three steps. The first stage represents an initial level of abstraction in which the significance of falls detected in the SaO2 signal are analyzed in order to determine whether or not they can be considered to be true desaturations. Established for this purpose are two input variables representing fall duration (“duration”) and reduction (“fall reduction”) that are partitioned using fuzzy trapezoidal sets. The output is established as a variable partitioned into five fuzzy triangular sets so as to establish its degree of membership to the desaturation concept (“event desaturation”). Defuzzification is done using the centroid method.
In the second stage, each apneic interval included in the apneic pattern—airflow and thoracic and abdominal movement signals- is evaluated. For each of the three signals, inputs of the fuzzy system are the duration of each existing apneic interval (“duration”), the associated reduction (“reduction”) and the degree of membership evaluated in the first phase and referring to the desaturation concept (“desaturation degree of membership”). The output for this stage consists of three fuzzy variables—apnea, hypopnea and false positive—that are partitioned on the basis of fuzzy triangular sets.
By applying the above described procedure we thus obtain for each apneic pattern (AP), a single measure of its degree of membership with respect to the apnea, hypopnea and false positive output variables: 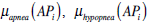 and
and  . Artifact information from the neumo-logical signals is taken into account at the reasoning phase. In this process two different types of artifacts are considered: (1) Artifacts taking place in the event itself –i.e., artifacts for which their temporal occurrence is within an apneic interval-, and (2) Artifacts that, although they do not temporally overlap with an event, they may influence its detection.
Once the reasoning and contextual adjusting processes have been performed, the output of the apneic detection phase is a set of apneic patterns finally confirmed as apneic events (either apnea or hypopnea).
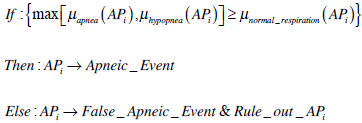
Let and to be the final degrees of membership in the apnea, hypopnea and normal respiration fuzzy sets of the apneic pattern, i = 1..n, where n is the total number of apneic patterns. The process that determines whether apneic patterni is finally confirmed or otherwise is discarded as apneic event is as follows:
Finally independently of final confirmation of the apneic event, for each apneic pattern, numerical values representing degrees of membership are characterized in terms of linguistic labels (Fig. 16).
Classification of Apneic Events: Recorded signals of respiratory movements are analyzed using signal processing techniques. The objective is to extract relevant information to associate to each apneic event previously confirmed. Reasoning stage carries out an analysis which performs a fuzzy classification of the corresponding apneic event with respect to three possible outputs: obstructive, mixed and central.
In this respect, first classification processing stage proceeds in the following form. For each apneic event confirmed at the detection phase:
- Derivations of thoracic and abdominal respiratory movements are analyzed in the context of the corresponding apneic pattern by firstly filtering high frequencies (low pass filter, 2 Hz) in order to remove possible high frequency noise present in the signals.
- Resulting filtered signal intervals are processed quantifying amplitude of internal breathing cycles. Let
 to be amplitude of the i-th respiratory cycle within the interval. Amplitude is measured as difference between maximum and minimum values of the respiratory cycle.
- Taking as reference the starting of the apneic event, a reference interval is taken going Δref seconds back in time. Then the same processing as in (1) and (2) is performed over this reference interval. The output is the baseline period by means of which to compare the amplitude of respiratory cycles during the apneic event with the average of respiratory cycle’s amplitude within this reference interval. We call φref such average amplitude.
- Then, the two respiratory channels are segmented in the time interval of the apneic event, by comparing the amplitude of the respiratory cycles with their corresponding reference values. Segmentation is performed in accordance with the following method:
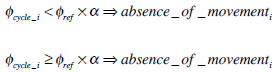
That is, if amplitude reduction shown by the corresponding i-th cycle with respect to average reference amplitude is higher than certain threshold α , then the respiratory cycle is labeled as absence of movement. On the other hand if reduction does not overpass the threshold, then the respiratory cycle is labeled as presence of movement. The process is illustrated in Figs. (17, 18).
- Once the signals have been segmented on intervals of presence/absence of movement, the whole interval is subdivided into 3 subsegments of equal length representing starting, center and ending points of the event. For each one of these subintervals the percentage of absence and presence is quantified. Additionally, for each one of the corresponding subintervals in the two signals, linear correlation is computed (Fig. 19).
Linear correlation between the different sections of the event complements with information on phase of the two signals, previous quantification on the amount of registered movement (absence/presence). Central events are characterized by thoracic movements in phase with those from the abdominal respiration-positive correlation-. On the other hand, during occurrence of an event of an obstructive origin, sinusoidal waves from thoracoabdominal derivations tend to present certain phase lag which results in negative correlation.
Once processing of thoracoabdominal signals has concluded, resulting extracted features are fed into a fuzzy system to perform classification of the event. A total of six features are used for classification: average of presence of movement over the two signals for each of the three subintervals, and liner correlation obtained for each one of them.
Unlike the fuzzy system used at the detection stage, here the inferential process is carried out in just one step. Therefore the number of input variables is six in correspondence with the number of input features. The output is a fuzzy classification of the corresponding apneic pattern (i.e., obstructive, central or mixed events).
3. DESIGN OF VALIDATION TESTS
In this section design of the validation tests is described in order to check system’s performance. Causistic for validation is taken from the database resulted from the Sleep Heart Health Study (SHHS). This database to which access has been granted by the Case Western Reserve University previous agreement for collaboration, emerges from a cohort initiative of several medical centers and universities in the United States, supported by the National Heart Lung & Blood Institute (NHLBI) [9].
Database comprises a set of polysomnographic record-ings from real patients in European Data Format (EDF). Each recording is accompanied by respective XML annotation file in which events that resulted from physicians’ offline analysis were marked. Thus, validation of the developed system will be based on comparison of its results using the standard reference constituted by annotations of the SHHS experts [10, 11].
The following aspects have been analyzed: (1) Validation of system’s capabilities for the identification of apneic events, and (2) Validation of the classification of the apneic events identified.
In order to carry out the tests, a total of 26 patients (mean age ± std.deviation: 68.5±7.7) from the SHHS database are randomly chosen without previous knowledge of the clinical history of the participants. The set of 26 patients form a completely independent set in order to ensure adequate evaluation of generalization capabilities of the system. In total the 26 testing recordings included in the study involve 15540 minutes of sleep monitoring.
3.1. Apneic Events Detection
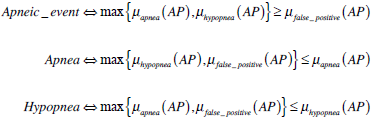
Since every apneic pattern has associated three different degrees of membership with respect to categories apnea, hypopnea and false positive, assigment of an apneic pattern (AP) to a concrete category uses a maximum criterion. That is:
Any given event can be represented by a segment located in time and demarcated by a starting point and an ending point. However it is very difficult to compare two segments in terms of an exact coincidence according to their starting and ending points.
The proposed solution consists in the segmentation of the temporal axis into classifiable—and therefore comparable—units. The concept of epoch (i.e. time segments of constant duration used in the previously mentioned database) can be taken as an arbitrary unit of time in the context of sleep studies. Thus, by locating the mid-point of the segment that represents the event, this can be unequivocally assigned to an epoch, and the validation process can be implemented by comparing epochs annotated, respectively, by either the system or the standard reference (Fig. 20).
Therefore we use the concept of epoch in order to decide on the existence of an apneic event within the epoch. Once an apneic event is localized in a concrete epoch through its mid-point, then validation regarding its concrete type can also be assessed. For this purpose, epochs in which there is positive agreement in apneic events location are used in order to validate the system with respect to classification of events as apneas or hypopneas. On the other hand since validation is performed for epochs, in order to correctly validate apneic event classification only epochs with just one apneic event are considered.
3.2. Apneic Events Classification
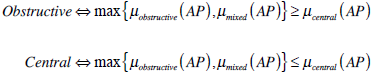
Three different classes of apneic events are considered for classification: obstructive, central or mixed. However no distinction is made in the database between mixed apneas and obstructive apneas. Therefore, for validation purposes, events classified as mixed for our system will be considered within the obstructive category according with their prevalence. Again the maximum criterion is applied for classification of the confirmed apneic event into a concrete category, and therefore:
The type of validation measures to be used involves calculation of agreement ratios for each of the former apnea categories: obstructive and central. It has to be taken into account that obviously, only the set of true positives for the class apnea can be evaluated for this classification. Results of the validation process and the corresponding data analysis are shown in the next section.
4. RESULTS
Table 1 summarizes the validation results for 15540 minutes of polysomnographic recordings. Each recording represents a patient affected to some degree by SAHS. Wilcoxon paired sign rank test does not detect significant differences among the individual recordings at the 0.05 significance level (p-value 0.067). Therefore, although individual differences can be shown in this respect among some of the recordings, the general trend maintains. Nonetheless, taking a look to the agreement ratios it can be shown a general tendency toward specificity of the system (0.916) whereas slightly lower sensitivity (0.813) is achieved.
Results for the validation regarding the location of apneic events.
| Apneic Event Location | |||||||||||
|---|---|---|---|---|---|---|---|---|---|---|---|
| RN | Epochs | Apneic Events | TP | FN | TN | FP | AgrI | Sens | Spec | AUC | |
| SR | System | ||||||||||
| 200088 | 1200 | 162 | 136 | 87 | 75 | 989 | 49 | 0.897 | 0.537 | 0.953 | 0.745 |
| 200259 | 1233 | 645 | 630 | 580 | 65 | 538 | 50 | 0.907 | 0.899 | 0.915 | 0.907 |
| 200386 | 1312 | 359 | 380 | 306 | 53 | 879 | 74 | 0.903 | 0.852 | 0.922 | 0.887 |
| 200532 | 1020 | 481 | 497 | 396 | 85 | 438 | 101 | 0.818 | 0.823 | 0.813 | 0.818 |
| 200568 | 1170 | 139 | 137 | 67 | 72 | 961 | 70 | 0.879 | 0.482 | 0.932 | 0.707 |
| 200929 | 1320 | 471 | 523 | 419 | 52 | 745 | 104 | 0.882 | 0.890 | 0.878 | 0.884 |
| 201249 | 1140 | 444 | 440 | 342 | 102 | 598 | 98 | 0.825 | 0.770 | 0.859 | 0.815 |
| 201294 | 1200 | 554 | 541 | 491 | 63 | 596 | 50 | 0.906 | 0.886 | 0.923 | 0.904 |
| 201394 | 1364 | 120 | 135 | 49 | 71 | 1158 | 86 | 0.885 | 0.408 | 0.931 | 0.670 |
| 201824 | 1168 | 394 | 441 | 325 | 69 | 658 | 116 | 0.842 | 0.825 | 0.850 | 0.838 |
| 202275 | 1140 | 346 | 332 | 251 | 95 | 713 | 81 | 0.846 | 0.725 | 0.898 | 0.812 |
| 202666 | 1120 | 77 | 79 | 34 | 43 | 998 | 45 | 0.921 | 0.442 | 0.957 | 0.699 |
| 202733 | 1200 | 275 | 337 | 223 | 52 | 811 | 114 | 0.862 | 0.811 | 0.877 | 0.844 |
| 202956 | 1200 | 406 | 420 | 342 | 64 | 716 | 78 | 0.882 | 0.842 | 0.902 | 0.872 |
| 203249 | 1260 | 413 | 390 | 318 | 95 | 775 | 72 | 0.867 | 0.770 | 0.915 | 0.842 |
| 203294 | 1050 | 58 | 65 | 41 | 17 | 968 | 24 | 0.961 | 0.707 | 0.976 | 0.841 |
| 203494 | 1260 | 486 | 534 | 438 | 48 | 678 | 96 | 0.886 | 0.901 | 0.876 | 0.889 |
| 203645 | 1364 | 585 | 548 | 463 | 122 | 694 | 85 | 0.848 | 0.791 | 0.891 | 0.841 |
| 203798 | 1119 | 543 | 499 | 463 | 80 | 540 | 36 | 0.896 | 0.853 | 0.938 | 0.895 |
| 204135 | 1200 | 281 | 377 | 249 | 32 | 791 | 128 | 0.867 | 0.886 | 0.861 | 0.873 |
| 204452 | 1110 | 46 | 59 | 26 | 20 | 1031 | 33 | 0.952 | 0.565 | 0.969 | 0.767 |
| 204480 | 1320 | 60 | 88 | 45 | 15 | 1217 | 43 | 0.956 | 0.750 | 0.966 | 0.858 |
| 205813 | 940 | 37 | 40 | 19 | 18 | 882 | 21 | 0.959 | 0.514 | 0.977 | 0.745 |
| 205948 | 1030 | 92 | 102 | 51 | 41 | 887 | 51 | 0.911 | 0.554 | 0.946 | 0.750 |
| 206040 | 1320 | 636 | 673 | 567 | 69 | 578 | 106 | 0.867 | 0.892 | 0.845 | 0.868 |
| 206181 | 1320 | 306 | 352 | 251 | 55 | 913 | 101 | 0.882 | 0.820 | 0.900 | 0.860 |
| Total | 31080 | 8416 | 8755 | 6843 | 1573 | 20752 | 1912 | 0.888 | 0.813 | 0.916 | 0.864 |
RN = Recording Number; SR = Standard Reference; TP = True Positive; FN = False Negative; TN = true negative; FP = False Positive; AgrI = Agreement index; Sens = Sensitivity; Spec = Specificity; AUC = Area Under ROC Curve.
Validation results for characterization of apneic events as apneas or hypopneas.
| Apnea/Hypopnea Characterization | |||||||||||
|---|---|---|---|---|---|---|---|---|---|---|---|
| RN | Epochs | Apnea | Hypopnea | AgrI | AUC | ||||||
| TP | FN | TN | FP | Sens | Spec | Sens | Spec | ||||
| 200088 | 83 | 2 | 0 | 77 | 4 | 1.000 | 0.951 | 0.951 | 1.000 | 0.952 | 0.975 |
| 200259 | 554 | 409 | 31 | 94 | 20 | 0.930 | 0.825 | 0.825 | 0.930 | 0.908 | 0.877 |
| 200386 | 259 | 51 | 17 | 175 | 16 | 0.750 | 0.916 | 0.916 | 0.750 | 0.873 | 0.833 |
| 200532 | 318 | 39 | 14 | 250 | 15 | 0.736 | 0.943 | 0.943 | 0.736 | 0.909 | 0.840 |
| 200568 | 63 | 11 | 4 | 48 | 0 | 0.733 | 1.000 | 1.000 | 0.733 | 0.937 | 0.867 |
| 200929 | 409 | 347 | 20 | 24 | 18 | 0.946 | 0.571 | 0.571 | 0.946 | 0.907 | 0.758 |
| 201249 | 308 | 53 | 1 | 225 | 29 | 0.981 | 0.886 | 0.886 | 0.981 | 0.903 | 0.934 |
| 201294 | 449 | 139 | 14 | 276 | 20 | 0.908 | 0.932 | 0.932 | 0.908 | 0.924 | 0.920 |
| 201394 | 44 | 6 | 0 | 32 | 6 | 1.000 | 0.842 | 0.842 | 1.000 | 0.864 | 0.921 |
| 201824 | 306 | 156 | 15 | 125 | 10 | 0.912 | 0.926 | 0.926 | 0.912 | 0.918 | 0.919 |
| 202275 | 206 | 49 | 12 | 122 | 23 | 0.803 | 0.841 | 0.841 | 0.803 | 0.830 | 0.822 |
| 202666 | 34 | 0 | 0 | 34 | 0 | --- | 1.000 | 1.000 | --- | 1.000 | --- |
| 202733 | 180 | 140 | 4 | 26 | 10 | 0.972 | 0.722 | 0.722 | 0.972 | 0.922 | 0.847 |
| 202956 | 323 | 118 | 2 | 158 | 45 | 0.983 | 0.778 | 0.778 | 0.983 | 0.854 | 0.881 |
| 203249 | 300 | 10 | 7 | 268 | 15 | 0.588 | 0.947 | 0.947 | 0.588 | 0.927 | 0.768 |
| 203294 | 26 | 1 | 0 | 24 | 1 | 1.000 | 0.960 | 0.960 | 1.000 | 0.962 | 0.980 |
| 203494 | 427 | 307 | 4 | 80 | 36 | 0.987 | 0.690 | 0.690 | 0.987 | 0.906 | 0.838 |
| 203645 | 402 | 71 | 96 | 225 | 10 | 0.425 | 0.957 | 0.957 | 0.425 | 0.736 | 0.691 |
| 203798 | 421 | 201 | 24 | 164 | 32 | 0.893 | 0.837 | 0.837 | 0.893 | 0.867 | 0.865 |
| 204135 | 243 | 81 | 5 | 143 | 14 | 0.942 | 0.911 | 0.911 | 0.942 | 0.922 | 0.926 |
| 204452 | 25 | 2 | 2 | 20 | 1 | 0.500 | 0.952 | 0.952 | 0.500 | 0.880 | 0.726 |
| 204480 | 40 | 14 | 1 | 24 | 1 | 0.933 | 0.960 | 0.960 | 0.933 | 0.950 | 0.947 |
| 205813 | 19 | 0 | 0 | 19 | 0 | --- | 1.000 | 1.000 | --- | 1.000 | --- |
| 205948 | 51 | 1 | 1 | 47 | 2 | 0.500 | 0.959 | 0.959 | 0.500 | 0.941 | 0.730 |
| 206040 | 507 | 267 | 31 | 185 | 24 | 0.896 | 0.885 | 0.885 | 0.896 | 0.892 | 0.891 |
| 206181 | 234 | 73 | 4 | 137 | 20 | 0.948 | 0.873 | 0.873 | 0.948 | 0.897 | 0.910 |
| Total | 6231 | 2548 | 309 | 3002 | 372 | 0.892 | 0.890 | 0.890 | 0.892 | 0.891 | 0.891 |
RN = Recording Number; SR = Standard Reference; TP = True Positives; FN = False Negatives; TN = True Negatives; FP = False Positives; AgrI = Agreement Index; Sens = Sensitivity; Spec = Specificity; AUC = Area Under ROC Curve.
Results of the validation for apneic event classification.
| Obstructive/Central Classification | |||||||||||
|---|---|---|---|---|---|---|---|---|---|---|---|
| RN | Epochs | Obstructive | Central | AgrI | AUC | ||||||
| TP | FN | TN | FP | Sens. | Spec. | Sens. | Spec. | ||||
| 200088 | 2 | 2 | 0 | 0 | 0 | 1,000 | --- | --- | 1,000 | 1,000 | --- |
| 200259 | 409 | 136 | 91 | 157 | 25 | 0,599 | 0,863 | 0,863 | 0,599 | 0,716 | 0.731 |
| 200386 | 51 | 31 | 5 | 9 | 6 | 0,861 | 0,600 | 0,600 | 0,861 | 0,784 | 0.731 |
| 200532 | 39 | 22 | 5 | 11 | 1 | 0,815 | 0,917 | 0,917 | 0,815 | 0,846 | 0.866 |
| 200568 | 11 | 11 | 0 | 0 | 0 | 1,000 | --- | --- | 1,000 | 1,000 | --- |
| 200929 | 347 | 325 | 11 | 10 | 1 | 0,967 | 0,909 | 0,909 | 0,967 | 0,965 | 0.938 |
| 201249 | 53 | 53 | 0 | 0 | 0 | 1,000 | --- | --- | 1,000 | 1,000 | --- |
| 201294 | 139 | 136 | 3 | 0 | 0 | 0,978 | --- | --- | 0,978 | 0,978 | --- |
| 201394 | 6 | 6 | 0 | 0 | 0 | 1,000 | --- | --- | 1,000 | 1,000 | --- |
| 201824 | 156 | 30 | 11 | 85 | 30 | 0,732 | 0,739 | 0,739 | 0,732 | 0,737 | 0.735 |
| 202275 | 49 | 27 | 3 | 13 | 6 | 0,900 | 0,684 | 0,684 | 0,900 | 0,816 | 0.792 |
| 202666 | 0 | 0 | 0 | 0 | 0 | --- | --- | --- | --- | --- | --- |
| 202733 | 140 | 8 | 13 | 113 | 6 | 0,381 | 0,950 | 0,950 | 0,381 | 0,864 | 0.665 |
| 202956 | 118 | 104 | 0 | 0 | 14 | 1,000 | 0,000 | 0,000 | 1,000 | 0,881 | 0.500 |
| 203249 | 10 | 10 | 0 | 0 | 0 | 1,000 | --- | --- | 1,000 | 1,000 | --- |
| 203294 | 1 | 0 | 0 | 1 | 0 | --- | 1,000 | 1,000 | --- | 1,000 | --- |
| 203494 | 307 | 97 | 67 | 109 | 34 | 0,591 | 0,762 | 0,762 | 0,591 | 0,671 | 0.677 |
| 203645 | 71 | 57 | 4 | 4 | 6 | 0,934 | 0,400 | 0,400 | 0,934 | 0,859 | 0.667 |
| 203798 | 201 | 63 | 29 | 80 | 29 | 0,685 | 0,734 | 0,734 | 0,685 | 0,711 | 0.709 |
| 204135 | 81 | 7 | 2 | 51 | 21 | 0,778 | 0,708 | 0,708 | 0,778 | 0,716 | 0.743 |
| 204452 | 2 | 2 | 0 | 0 | 0 | 1,000 | --- | --- | 1,000 | 1,000 | --- |
| 204480 | 14 | 14 | 0 | 0 | 0 | 1,000 | --- | --- | 1,000 | 1,000 | --- |
| 205813 | 0 | 0 | 0 | 0 | 0 | --- | --- | --- | --- | --- | --- |
| 205948 | 1 | 1 | 0 | 0 | 0 | 1,000 | --- | --- | 1,000 | 1,000 | --- |
| 206040 | 267 | 219 | 16 | 26 | 6 | 0,932 | 0,813 | 0,813 | 0,932 | 0,918 | 0.872 |
| 206181 | 74 | 59 | 15 | 0 | 0 | 0,797 | --- | --- | 0,797 | 0,797 | --- |
| Total | 2549 | 1420 | 275 | 669 | 185 | 0,838 | 0,783 | 0,783 | 0,838 | 0,820 | 0.811 |
RN = Recording Number; TP = True Positives; FN = False Negatives; TN = True Negatives; FP = False Positives; Sens = Sensitivity; Spec = Specificity; AgrI = Agreement Index; AUC = Area Under ROC Curve.
Subsequently, in Table 2, epochs in which there is positive agreement in apneic events location are used in order to validate the system with respect to characterization of events either as apneas or hypopneas. Sensitivity and specificity are given in table, 40 for apneas also with dual values for hypopneas. As expected, respective values are complementary. For the apnea category, Table 2 shows an overall sensitivity of 0.892 and a specificity of 0.890 for the apnea category. As previously indicated, the complementary nature of the categories causes a duality in the interchange of the values associated with the sensitivity and specificity indices (0.890 and 0.892, respectively) when considering the hypopnea category. It can be concluded that in general terms the system shows stability among the different agreement ratios in the apnea/hypopnea discrimination task. In fact Kruskal-Wallis test reported no statistical differences among the distributions of the different indexes (p-value = 0.433).
Table 3 shows validation results achieved using the set of 26 patients with regard to apneic event classification as obstructive or central. In this respect it has to be remarked that only the set of true positives for the class apnea can be evaluated for classification. This justifies the number of epoch in the second column of Table 3. On the other hand it has been also mentioned that since standard reference only makes distinction between obstructive and central events, for validation purposes, mixed events by the system were included within the obstructive category.
Analysis of the results reveals a system more sensitive to the classification of obstructive events (0,838) than with respect to central events (0,783). Once again since class categories are complementary the trend swaps when looking at overall indexes for specificities. As previously noted, detection of central events improves when the proportion of obstructive events decreases; however the increase in the agreement index confirms that major classification performance (less number of misclassified events) is achieved when the prevalent event in the recording is of obstructive type.
DISCUSSION AND CONCLUSION
Analysis of the neumological activity comprises processing of the signals related with the respiratory function. Signal processing includes the detection and characterization of overflow and loss of focus intervals, applying signal reconstruction where possible. Subsequent analysis of the signal comprises the identification of apneic intervals and the localization of descending (possible desaturations) and ascending (possible resaturations) intervals in the SaO2 signal [12, 13]. For each individual event detected, features are then extracted to characterize the
event with quantifiable data [14]. Once all the respiratory signals have been analyzed, temporal correlation of the individual events is performed. The result of the temporal correlation is what it has been called apneic pattern. An apneic pattern defines a group of inter-related events as with potential diagnostic relevance. In this respect a first level of temporal constraints involves the respiratory events located in the neumological signals [15]. Temporal correlation is guided by the principle of physiological significance: saturation falling intervals detected over the SaO2 signal are used as triggers, defining searching intervals to establish the corresponding cause-effect relationships with the corresponding apneic intervals.
Once temporal correlation of the neumological events has been performed, the quantitative and qualitative information from the different events that integrate the apneic pattern is then evaluated using fuzzy inference [16]. Knowledge is implemented through IF-THEN fuzzy rules that use linguistic terms in natural language, and a degree of membership is obtained regarding each possible classification, i.e. considering the possibility of the pattern as being considered an apnea, a hypopnea, or to be discarded as a false positive. A similar process is scheduled for the subsequent classification of the apneic events as obstructive, central or mixed. Therefore categorical judgments are avoided, and besides, the use of linguistic labels, enables follow up of the inferential process and explanation capabilities by tracking the set of activated rules according to the given input.
An epoch-by-epoch validation was scheduled regarding capabilities for the location of the apneic events showing overall agreement of 0.89 over the 26 tested recordings, with sensitivity of 0.81 and specificity of 0.92. Not significant individual differences were detected over the recordings, however positive correlation was found regarding sensitivity of the system and severity of the syndrome, while negative correlation was found for detection accuracy. Further analysis suggested that when the proportion of apneic events in the recording is low, then the severity of the associated events is more reduced: that is, predominant apneic events are of the very mild hypopneas. Therefore, accurate detection of these events for the human eye is more difficult, which increases subjectivity in the detection, thus agreement in the temporal detection is more reduced. At the same time, the proportion of negative cases is so high that total agreement tends to remain high. On the other hand, as the severity of the syndrome increases, it also does the sharpness of the associated events, which increments the proportion of true positives, and the sensitivity of the detection. A general reduction in the agreement between human scorers has been reported in the literature as a function of the severity of the syndrome. Therefore the system behaves as expected. Evaluation of discriminative capabilities of the developed system was also assessed on the characterization of apnea/hypopnea events, and their classification as obstructive/mixed/central. Results show, in the first case, overall sensitivity and specificity of 0.89. For the classification of apnea events, resulting sensitivity and specificity was 0.84 and 0.78 respectively for the obstructive category. Validation of apneic events classification required of mixed events from the system to be considered within the obstructive category. No attempts were performed by SHHS scorers neither to distinguish between obstructive and mixed, nor to classify hypopnea events.
According to the obtained results, robust characterization of the apneic event as apnea or hypopnea is achieved by the system (no significant bias has been detected favoring any particular class). On the other hand, in the case of apnea classification statistical significance was found between classification of obstructive and central events, with higher sensitivity for the detection of obstructive events.
Several future research lines and extensions can be proposed for the described approach. Among these the following ones can be highlighted: 1. Extension of the temporal model incorporating support for imprecision among the temporal objects, 2. Improvements in the definition of the temporal relationships, and 3. Integration of the extended temporal model within the system to act as temporal reasoning module in charge of the inferential processes for the detection of relevant events.
CONFLICT OF INTEREST
The authors confirm that this article content has no conflict of interest.
ACKNOWLEDGEMENTS
This work was funded in part by the Xunta de Galicia through projects CN2011/007 and CN2012/211, both partially supported by the European Union ERDF.