RESEARCH ARTICLE
GlycomicsDB - A Data Integration Platform for Glycans and their Strucutres
Mahesh Visvanathan*, 1, Sasidhar R Siddam1, In-Hee Lee1, Gerald H Lushington1, George R Bousfield2
Article Information
Identifiers and Pagination:
Year: 2011Volume: 5
First Page: 9
Last Page: 16
Publisher Id: TOMINFOJ-5-9
DOI: 10.2174/1874431101105010009
Article History:
Received Date: 1/9/2010Revision Received Date: 11/3/2011
Acceptance Date: 14/3/2011
Electronic publication date: 19/4/2011
Collection year: 2011
open-access license: This is an open access article licensed under the terms of the Creative Commons Attribution Non-Commercial License (http://creativecommons.org/licenses/by-nc/3.0/) which permits unrestricted, non-commercial use, distribution and reproduction in any medium, provided the work is properly cited.
Abstract
Glycomics is a discipline of biology that deals with the structure and function of glycans (or carbohydrates). Analytical techniques such as mass spectrometry (MS) and nuclear magnetic resonance (NMR) are having a significant impact on the field of glycomics. However, effective progress in glycomics research requires collaboration between laboratories to share experimental data, structural information of glycans, and simulation results. Herein we report the development of a web-based data management system that can incorporate large volumes of data from disparate sources and organize them into a uniform format for users to store and access. This system enables participating laboratories to set up a shared data repository which members of interdisciplinary teams can access. The system is able to manage and share raw MS data and structural information of glycans.
The database is available at http://www.glycomics.bcf.ku.edu
1. . INTRODUCTION
Glycomics, the scientific attempt to characterize and study complex carbohydrates (glycans), is a rapidly emerging branch of science [1]. Carbohydrates can be found as homo-polymers but are often attached to proteins (to form glycoproteins) and lipids (to form glycolipids). Apart from their well known use in energy storage and expenditure, the roles of carbohydrates in living organisms are varied and fundamental. Glycans can have structural and modulatory functions by themselves or can modulate the function of molecules to which they are attached by the specific recognition of the glycan structure by carbohydrate-binding proteins. Glycans also regulate both the folding and degradation of proteins. Moreover, since the outer cell membrane is covered by carbohydrates, they mediate interactions with other cells of the same organism or other pathogenic organisms such as viruses and bacteria.
The critical role of glycans in diseases and their utility as biomarkers have been widely recognized and the development and use of informatics tools and databases for glycomics research has increased considerably in recent years. However, the general development can still be considered as being in its infancy when compared to other popular "-omics" areas. The major challenge in the field of glycomics is the intrinsic complexity in glycan structures. A highly branched structure employing 32 types of sugar linkages suggests a high level of complexity in glycan structures. This is confounded by the complex biosynthetic pathway for N-glycans, consisting of assembly of precursor, en bloc transfer to a nascent glycoprotein, degradation of glycan, synthesis of 1-4 complex branches, and termination of the branches with sialic acid or sulfate. To tackle these difficulties, several research efforts to build and maintain a database of glycan information have been established. Several relational databases and interfaces to facilitate linking data such as glycan, glycosyltransferase, and glycan binding proteins (GBPs) are provided by the Consortium for Functional Glycomics (CFG, http://functionalglycomics. org/) [2]. And the GlycomeDB (http://glycome-db.org/) was built as a web portal to public structural data in glycomics [3]. Also the GlycoSuiteDB (http://www.glycosuite.com/) maintains records of glycans and their GBPs [4]. Recently, the EUROCarbDB project (http://www.eurocarbdb.org/) is launched to develop a framework where research groups can feed their primary data. The Russian Bacterial Carbohydrate Structure DataBase (BCSDB, http://www.glyco.ac.ru/bcs db3/) provides all published glycan structures found in bacteria as well as their simulated NMR data [5]. The GLYC OSCIENCES.de (http://www.glycosciences.de/) attempts to link glycan-related data originating from various sources ranging from sequences to 3D structures and GBPs [6]. Similarly, the Kyoto Encyclopedia of Genes and Genomes (KEGG) provides a glycan structure databases, KEGG glycan (http://www.genome.jp/kegg/glycan/), along with related pathways and enzymes [7].
But still lacking is a data integration platform to assist a group of collaborating researchers to share experimental data and information before they publish their results in journal articles or public databases. Let us take an example of glycan structure-function studies involving mass spectrometry (MS), one of the most favored methods to determine glycan composition. Given the array of equipment necessary for MS experiments, structure-function studies can prove to be very labor intensive and is often best performed as a multidisciplinary collaborative venture. Manually annotating each mass peak may require in weeks of analysis for one mass spectrum, but the interpretation process greatly benefits from supplementary biochemical data. For example, the sequence of the peptide moiety of a glycopeptide can be used to help identify glycopeptide ions, as the expected peptide mass can be predicted from the amino acid sequence. However, these data are usually generated in separate laboratories. Thus a key issue is to make the data available to all collaborators in a timely manner. It is typical that compiling data from MS experiments alone requires weeks of dedicated effort. The task of tracking and merging all different types of data including MS data from individual laboratories is often beyond the capacity of a group of people. However, most of the aforementioned databases concentrate on tracking glycan compositions and two-dimensional (2D) structures. There exist a few approaches for integrating glycan information and primary MS or nuclear magnetic resonance (NMR) data, such as: EUROCarbDB, KEGG glycan, and GLYCOSCIENCES.de. The integrative approach for glycomics research is still in an early developmental stage and there exists a lot of room for exploration.
We here propose a web-based data management system that can incorporate large volume of data from disparate sources and organize them into a uniformed format for users to share. The proposed system will enable the collaborating laboratories to set up a shared data repository which members of interdisciplinary teams can access. For instance, the carbohydrate composition data of a given sample from a carbohydrate analyzer is linked to the sample’s corresponding MS data. In addition, the system can be used to store the additional structural data, either from an existing database or from modeling. As a preliminary step, we built a model system for a small research project to be undertaken by three geographically distributed laboratories in Kansas and Nebraska, USA. The web-based interface is accessible at the address http://www.glycomics.bcf.ku.edu/. Currently it is not open to public, but will be globally accessible upon system maturity.
The rest of this paper is organized as follows. Section 2 will give a brief introduction on the sample glycomics study on which our model system is based. Section 3 and 4 will explain the organization and features of our system. Section 5 will summarize and draw some conclusions.
2. . REPRESENTATIVE STUDY
A representative of the glycomics studies on which our data management system is built is an investigation of the loss of a partially glycosylated follicle-stimulating hormone (FSH) variant during the perimenopausal period. The perimenopausal period is often accompanied by several pathologic symptoms including irregular reproductive cycles, dysfunctional uterine bleeding, declining bone mass, and psychological impairment. The overall hypothesis in the sample study is that the switch from di- to tetra-glycosylated FSH further compromises reproductive function and at the same time may hasten the loss of bone mass. For this purpose, we need to characterize different human FSH (hFSH) glycoforms to obtain knowledge about their glycan structures and site-specific distribution in the hormone. These data will be generated in three laboratories and need to be available to all project participants.
Our data management system acts as both an online warehouse to store and distribute raw MS data among participating laboratories and a bulletin board to share MS data interpretation (glycan structures, glycosylation sites occupancy, etc.) among laboratories. For example, if laboratory A produces a set of raw MS data and puts it in the system, then laboratory B may interpret the mass spectra to identify glycans, while laboratory C pursues functional studies with the identified glycans. Storing all of the resulting information in an integrated form and sharing among laboratories will help researchers to maintain an overview of the entire biological system under study.
3. SYSTEM ORGANIZATION
3.1. Overview
Our data management system aims to support the glycomics study by storing raw MS data and glycan information in logical and integrated ways. In many ways, it differs from the existing glycomics databases. First of all, it provides an integrated management of glycan information and the associated MS data. This is a major difference from other glycomics databases, which usually focus on collecting specialized glycan information. For this purpose, it stores various kinds of data in a relational database where necessary information can be conveniently combined. The data handled in our system includes raw MS data of glycans, glycan structures (either in the form of 2D diagrams or 3D models), the hormone, specific subunit (α or β ), and Asn residue to which the glycan is attached, as well as source organism. It also provides a method to add memos as footnotes associated with specific glycan entries so that researchers can exchange messages about their work. For glycan structures, users can create their own 2D diagrams or 3D structural models using tools provided within the webpage to specify a glycan with its tentative (hypothetical) structure via a schematic editor. Another feature of our system is that it provides several operations for users to manage MS data for further research. It enables for users to create a new MS experiment entry in database. For existing MS experiment entries, users can edit, view, and combine data from one experiment with data from another MS experiment to compare related hormones.
The basic architecture of our system is summarized in Fig. (1). A relational database that stores the glycomics data lies at the bottom of our system. On top of it, a variety of modules run and interact with the user front-ends and with other public databases. The modules can be divided into 1) modules that act as interfaces for data acquisition and 2) those for dissemination of data. The relational database is implemented using MySQL on a Windows workstation. The Apache web server provides the web service.
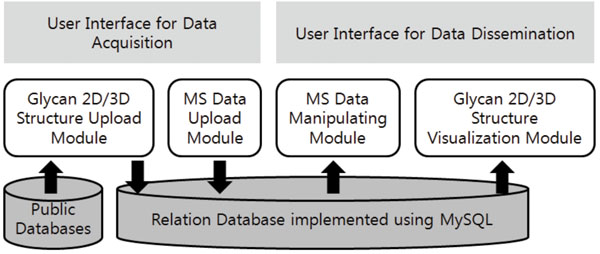 |
Fig. (1). The architecture of the web-based data management system. |
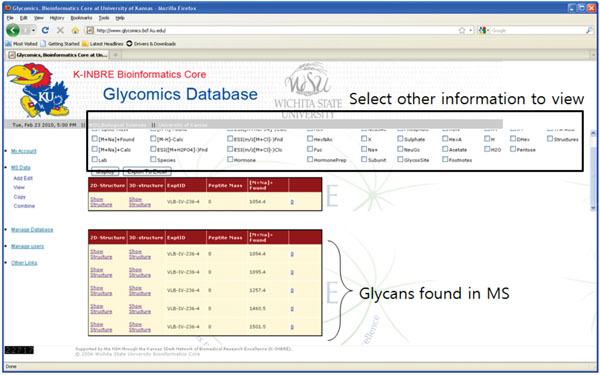 |
Fig. (2). A sample entry for a glycan MS experiment, showing 5 glycans found in the spectrum. |
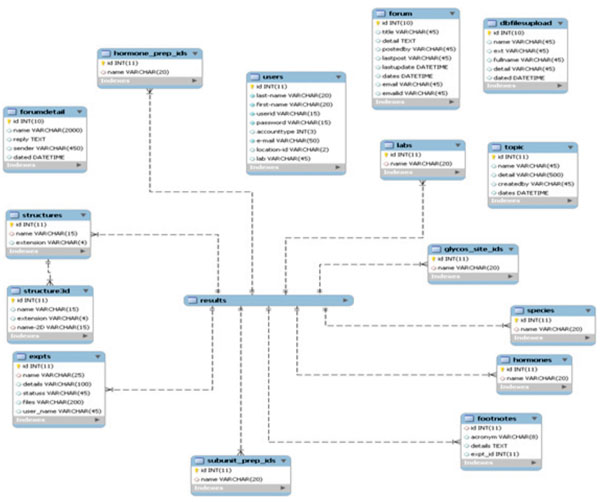 |
Fig. (3). The schema for the glycomics database. |
 |
Fig. (4). Flowchart for system features. |
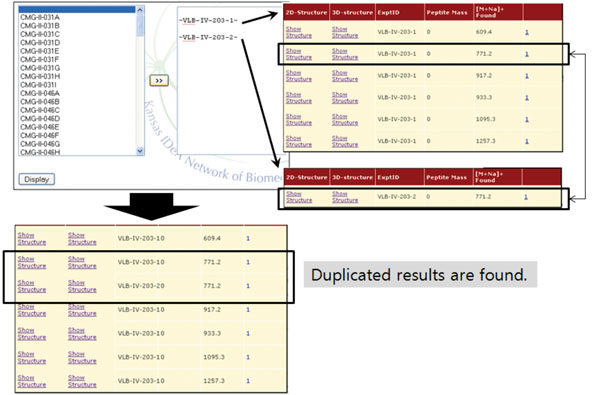 |
Fig. (6). The result of ‘Combine’ operation. A common entry is identified from two experiments. |
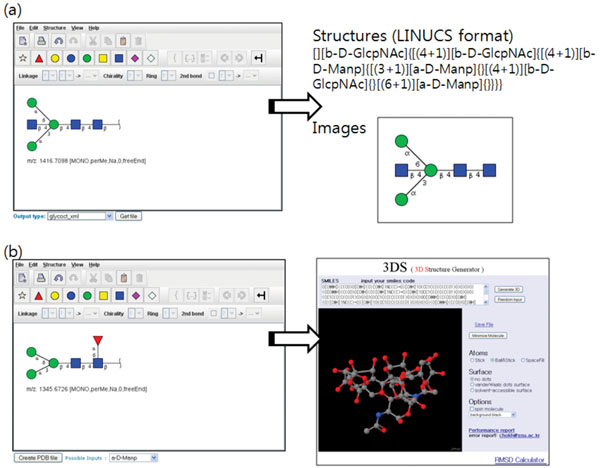 |
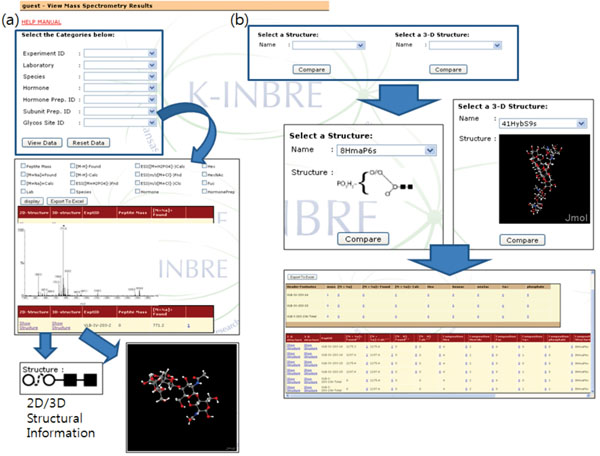
Fig. (7). Creating and visualizing (a) 2D glycan structure diagrams and (b) 3D glycan models. The created structures can be saved in several formats and be inserted into the system. |
3.2. Database Scheme
A single mass spectrometry experiment on a sample, consisting of raw MS data and the associated glycan information, forms the main unit entry in our system (Fig. 2). However, since it contains a variety of heterogeneous information, we decided to create separate tables for individual information and build an entry for individual MS experiment as a combination of tables. In this sense, an individual entry for a single MS data is conceptual and exists only from the users’ point of view. Fig. (2) shows a sample MS experiment result where 5 glycans were identified. Note that basic information on each glycan is shown the bottom table, and you can view other detailed information by selecting checkboxes in the top.
From the implementation point of view, individual information in our system is originally stored as separate tables in database (Fig. 3). At a user’s request, the items in each table are combined to build a unified entry as shown in Fig. (2).
The tables in Fig. (3) can be classified into 3 categories: experiment information, glycan information, and miscellaneous information. The following subsections will discuss each individual table.
3.2.1. Experiment Information
The tables in the experiment information category provide information about the MS experiment itself: the name of the experiment, the name of participating lab conducting this experiment, the species and name of the hormone or subunit preparation, etc. The tables belong to this category are: expts, labs, species, hormones, hormone_prep_ids. These tables contain all the experiment names, laboratories, species, hormone names, hormone preparations in the system, respectively. Each of these tables acts as a catalog for the particular information about the experiment. These tables can be combined with the results table through their id attributes (the primary keys).
3.2.2. . Glycan Information
Tables in this category hold information about individual glycans encountered during the MS experiment. The most important table is the results table. It contains the chemical information obtained from MS experiment: peptide mass, glycan mass, monosaccharide composition, heteroatom composition, etc. It also contains foreign keys to other tables so that users can view them as a unified item to user. Each entry in this table is created when a user uploads MS experiment data. Therefore, one entry in the expts table can be related to multiple entries in the results table. The table does not check for duplicates when adding new entries. Thus, the same entry can appear from different associated experiments. Other tables in this category are: structures, structure3d, subunit_prep_ids, and glycos_site_ids. These tables contain the glycan structures (2D and 3D), subunit and glycosylation site location for each glycan, respectively. These tables can also be combined into the results table through their id attributes. One of main features in our system is that users can create entries in structures and structure3d tables using tools provided by the site to incorporate new knowledge of glycan structure.
3.2.3. . Miscellaneous Information
Tables in this category include: users, dbfilesupload, footnotes. These tables contain user information or users’ comments regarding experiments. The footnotes table can be associated with the results table through its id attribute.
4. SYSTEM FEATURES
The glycomics database has many features including the ability to create, add, delete, or combine MS experimental data and glycan structural interpretations. It also has the capability to export the data to Excel® spreadsheets. The menu in the main page provides entry points to tools including: (1) MS experiment management operations such as creating, viewing, editing, and combining, (2) database management operations such as adding, modifying, and deleting items in various database tables, and (3) glycan structure drawing and visualization. These functions are summarized in a flowchart (Fig. 4).
4.1. MS Experiment Management
There are four operations available for MS experiment management: (1) Add & Edit, (2) View, (3) Copy, and (4) Combine.
The ‘Add & Edit’ operation allows the user to add or modify information related to the MS experiment itself, or a specific glycan. To add a new MS experiment to the database, the user should first create a unique name for the experiment using the ‘Experiment ID’ item under the ‘Manage Database’ menu. The experiment name is then available in the ‘Add & Edit’ module so that users can add or modify MS data. When adding or modifying MS data, users can associate peaks or spectra with a known or user-created 2D/3D glycan structure. The procedure to create and add glycan structures will be explained further in later subsections. Also, users can add a footnote about specifics of a glycan or a peak.
The ‘View’ operation provides various ways to select and view entries in the database (Fig. 5). First, users can select and view database records based on MS experiment information such as experiment ID and laboratory name or sample information such as hormone and species. Fig. (5a) shows the database entry retrieved in this way. It should be noted that one can check the associated glycan structure, if available, from the retrieved data (bottom images in Fig. 5a). It is also possible to retrieve records associated with a certain glycan structure (Fig. 5b). Currently, a user can use only the glycan structures stored either in structures table or structure3d table for database searching. The retrieved results can be exported into a spreadsheet file.
The ‘Copy’ operation creates a new experiment entry based on existing experimental data sets. It provides a simple way of creating entries for data obtained under similar experimental conditions. Again, users need to create an appropriate ID for each new entry before copying from an existing one.
Finally, the ‘Combine’ operation merges different MS experiments into one. More specifically, once a user selects experiment IDs to be combined from expts table, the entries in results table associated with the selected IDs are retrieved and merged (Fig. 6). This operation can be useful when one wants to check for duplicated values among experiments. We would like to note that this is one of the unique features of our system. Only a few database systems incorporate primary MS data with glycan information, and none of them provide method to conveniently compare multiple MS spectra to find similarities and differences.
4.2. . Database Entry Management
Our system allows user to add, delete, or modify entries in almost every tables in the system except results, users, and dbfilesupload. The entries in results table cannot be removed manually. However, when deleting an experimental ID, users can choose to delete the entries associated with the ID. It is worth noting that users are allowed to add or delete entries in structures and structure3d tables. Adding new entries to these tables will be further explained in the next subsection.
4.3. . Glycan Structure Drawing/Visualization
As the knowledge on the glycan structure accumulates, new glycan structures can be found or suggested and users may want to incorporate them into the system so that the MS data contain up-to-date information. For this purpose, we provide methods to create and visualize new glycan structures and insert them into the system.
We adopted the GlycanBuilder [8] as a visual editor to assist user in drawing various glycan structures. Users can create a structure in the editor by sequentially adding various building blocks of glycan structure including a library of common structural motifs (core glycan structures and terminal monosaccharide residues). All the stereo-chemical information about glycan structures, like ring configuration and linkage position, can be specified. The edited 2D structure can be exported in various formats popular with the glycomics community: GlycoCT [9], GLYDE [10], LINUCS [11], and GlycoWorkbench file [12] including standard graphical formats (EPS, PDF, SVG, PNG, JPG, GIF, and BMP). The LINUCS (Linear Notation for Unique Description of Carbohydrate Sequences) format represents the glycan structure as a linear string. The GLYDE (GLYcan Data Exchange) format represents the glycan structure in XML. The GlycoCT format, developed as a part of EUROCarbDB project, also represents the glycan structure in XML, but it denotes the links that comprise a glycan structure as a connection table.
We also provide a way to visualize the created 2D structure diagram into 3D models and save it in Protein Data Bank format (PDB). The 2D structure is first represented as a SMILES (Simplified Molecular Input Line Entry Specification) strings and transferred to 3D Structure Generator (http://ebio.ssu.ac.kr) which can translate a SMILES string into a 3D model and export it as a PDB file. Along with the ability to combine and compare MS data freely, the visualization of glycan structures as 3D models is one of main features that distinguish our system from other utilities (Fig. 7).
Created and exported glycan structures can be incorporated into the system by adding them as new entries in either the structure table or structure3d table.
5. . DISCUSSION AND OUTLOOK
We developed a web-based data management system that can incorporate mass spectrometry experiment data from disparate sources and organize them into a uniformed format for users to share. Our online data management system offers the possibility for collaborating researchers to access and manage the shared glycomics data in a systematic manner within a single resource. It has several distinguishing features as compared to existing glycomics databases: it can handle raw mass spectral data and glycan structures in a systematic and integrated way and it provides a user-friendly interface to create, edit and manage glycan structures as 3D models as well as 2D diagrams.
In the near future, the system will contain an integrated interface to handle gene expression data for functional glycomics research. Furthermore, we are planning to improve the glycan structure creation/visualization interface so that users can create more complex glycan structures. Another planned extension is the integration of publicly-available software and databases for (semi)automatic annotation of mass spectrometry data and database search, which can make it easy to manage complex experimental data.
ACKNOWLEDGMENTS
This publication was made possible by grants numbered P20 RR016475 from the National Center for Research Resources (NCRR) and P01 AG029531 from the National Institute on Aging, components of the National Institutes of Health (NIH). We also thank Michael Netzer for reading the manuscript and making useful suggestions.


