
RESEARCH ARTICLE
Datamining Approach for Automation of Diagnosis of Breast Cancer in Immunohistochemically Stained Tissue Microarray Images
Keerthana Prasad*, 1, Bernhard Zimmermann2, Gopalakrishna Prabhu3, Muktha Pai4
Article Information
Identifiers and Pagination:
Year: 2010Volume: 4
First Page: 86
Last Page: 93
Publisher Id: TOMINFOJ-4-86
DOI: 10.2174/1874431101004010086
Article History:
Received Date: 4/10/2009Revision Received Date: 2/11/2009
Acceptance Date: 14/11/2009
Electronic publication date: 28/5/2010
Collection year: 2010
open-access license: This is an open access article licensed under the terms of the Creative Commons Attribution Non-Commercial License (http://creativecommons.org/licenses/by-nc/3.0/) which permits unrestricted, non-commercial use, distribution and reproduction in any medium, provided the work is properly cited.
Abstract
Cancer of the breast is the second most common human neoplasm, accounting for approximately one quarter of all cancers in females after cervical carcinoma. Estrogen receptor (ER), Progesteron receptor and human epidermal growth factor receptor (HER-2/neu) expressions play an important role in diagnosis and prognosis of breast carcinoma. Tissue microarray (TMA) technique is a high throughput technique which provides a standardized set of images which are uniformly stained, facilitating effective automation of the evaluation of the specimen images. TMA technique is widely used to evaluate hormone expression for diagnosis of breast cancer. If one considers the time taken for each of the steps in the tissue microarray process workflow, it can be observed that the maximum amount of time is taken by the analysis step. Hence, automated analysis will significantly reduce the overall time required to complete the study. Many tools are available for automated digital acquisition of images of the spots from the microarray slide. Each of these images needs to be evaluated by a pathologist to assign a score based on the staining intensity to represent the hormone expression, to classify them into negative or positive cases. Our work aims to develop a system for automated evaluation of sets of images generated through tissue microarray technique, representing the ER expression images and HER-2/neu expression images. Our study is based on the Tissue Microarray Database portal of Stanford university at http://tma.stanford.edu/cgi-bin/cx?n=her1, which has made huge number of images available to researchers. We used 171 images corresponding to ER expression and 214 images corresponding to HER-2/neu expression of breast carcinoma. Out of the 171 images corresponding to ER expression, 104 were negative and 67 were representing positive cases. Out of the 214 images corresponding to HER-2/neu expression, 112 were negative and 102 were representing positive cases. Our method has 92.31% sensitivity and 93.18% specificity for ER expression image classification and 96.67% sensitivity and 88.24% specificity for HER-2/neu expression image classification.
1. INTRODUCTION
Cancer of the breast is the 2nd most common human neoplasm, accounting for approximately one quarter of all cancers in females after cervical carcinoma. Estrogen receptor (ER), Progesteron receptor and human epidermal growth factor receptor (HER-2/neu) expressions play an important role in diagnosis and prognosis of breast carcinoma. It is observed that patients showing higher receptor expressions have delayed recurrence and longer survival rates compared to those lacking the receptor expressions [1].
Immunohistochemical evaluation of hormone receptor expression in tumor cell nuclei is an integral part of routine breast cancer diagnosis and provides important information with relevance for prognosis and choice of therapeutic approach. The TMA technique enables hundreds of tissue cores to be probed simultaneously by many different antibodies in a single run to evaluate the use of the antibodies as biomarkers, by using immunohistochemistry. Thus, TMA is used to provide fast and standardized images of the specimen. It facilitates high throughput analysis while minimizing tissue and reagent waste [2].
The basic tissue array technique is introduced by Kononen [3]. Using a tissue arraying instrument, a tissue core is removed from the area of interest from the histopathology block called the ‘donor block’ using a thin walled needle. The thin walled needle is held in an X-Y precision guide and is used to place the core into an empty paraffin block, called the ‘recepient block’, at a specifically designated location. This process can be repeated to embed thousands of such samples into the recipient blocks [4].
The authors in [5] describe the procedure for TMA construction. High sampling accuracy and screening reliability can be maintained by including multiple cores from each patient specimen. Also, four to six samples from the same morphologic area can be inserted into the array so that it compensates for the losses occurring during processing. Thus TMA facilitates combining hundreds of specimens of tissue onto a single slide for analysis. Having such a large number of spots on one single slide calls for a fast and efficient means of scoring and analyzing any biomarker data, so that a meaningful statistical analysis can be done. However, this kind of high throughput technique makes it difficult to manage data in each phase, from design to analysis and final report of results, which makes the software support almost inevitable. The basic technical aspects of TMA production, current and potential future applications are discussed in [6].
If one considers the time taken for each of the steps in the TMA process workflow, it can be observed that the maximum amount of time is taken by the analysis step. Hence, automated construction of TMA will probably have little impact whereas automated analysis will significantly reduce the overall time required to complete the study.
Reading the TMA spots in an orderly, reproducible and reliable manner is a quite difficult task to do manually since keeping track of the precise position of each spot in a slide with more than 300 spots is in itself highly challenging. The BLISS imaging system from Bacus Laboratories and ACIS system of Chromavision [7] are the digital solutions for automating the tasks of scanning and acquiring all spots on the slide in one go. ‘TMAScore’ marketed by Bacus Laboratories, facilitates scanning into virtual slides, placing the slide on a network, tracking and recording the scores from tissue cores etc.
For the proper organization and analysis of spots, a novel relational database for TMA analysis has been described using Adobe Photoshop for image-editing and Microsoft Excel for recording core coordinates and performing scoring in [8]. In this work, the digital images of individual cores are stored in a specified folder of the computer. The pattern of grids present in the TMA slide is represented in rows and columns of MS Excel worksheet. The hyperlinks for each of the grids are inserted in such a way that the hyperlink connects to the specific core and opens the corresponding image for further evaluation. This method is particularly useful when the number of images in the database does not exceed 150.
For high-throughput analysis, excellent set of software tools have been developed at Stanford University. The description of these software tools is available in [9]. The Tissue Microarray Database (TMAD; http://tma.stanford.edu/)at Stanford University is a web-based system that provides researchers with tissue microarray design tools, image scoring and annotation tools, data sharing mecha-nisms, an image archive, an analysis toolset and publication mechanism. These investigators used the BLISS System for generating a database of images. The software called ‘TMA Deconvoluter’ is used to reformat the Excel data into a text file so that it is suitable for cluster analysis by the use of ‘Cluster’ and ‘TreeView’ programs. This analyzes the relatedness within tumor subsets depending on the immunohistochemical biomarker profile. The TreeView software allows for rapid transformation of immunohisto-chemistry data into a format that can be used for cluster analysis by generating dendrograms. The ‘Stain Finder’ program acts as a hyperlink to the corresponding images archived in the database. This facilitates rapid retrieval of the immunoprofile of the archived cases. An on-line demonstration of this system is available at http://genome-www.stanford.edu/TMA/explore.shtml
Camp et al. have developed a system called AQUA (Automated Quantitative Analysis) [10] which uses fluorescent imaging to quantify TMA cores at the sub-cellular level, to provide a score that is directly proportional to the number of molecules expressed per unit area. An open-source java-based software called "TMAJ" is available from the website of the Johns Hopkins University TMA core facility [11] (http://tmaj.pathology.jhmi.edu/). This helps in recording pathology data as well as core tracking and scoring. Heyer et al. [12] have developed an integrated microarray data analysis tool called MAGIC which has been designed to explore and analyze all types of gene expression data.
TMA provides large standardized dataset of immunohistochemically stained images. The interpretation of these images relies solely on subjective visual estimates, yielding qualitative or semi quantitative results. Each of the spots of the tissue microarray has to be evaluated by a pathologist for assigning scores based on staining intensity to represent the antigen expression. [13] considers three different staining scores, maximum staining intensity, percentage of cells staining positive and percentage of cells staining with maximum intensity. This is a subjective and time consuming task.
The software support for automation of quantification of antigen expression in each of the spots is not enough. Attempts to automate the evaluation of antigen expression are reported in many studies [14-20], but they just identify the area of positive staining but do not discriminate the difference in depth of staining, which is very crucial for the scoring of spots.
Through this work, we attempt to automate the evaluation of the ER and HER-2/neu expression for diagnosis of breast cancer providing objective, fast and repeatable analysis.
2. MATERIALS USED
Our study is based on the Tissue Microarray Database portal of Stanford university at http://tma.stanford.edu/cgi-bin/cx?n=her1, which has made huge number of images available to researchers. We downloaded 171 images corresponding to estrogen receptor (ER) expression and 214 images corresponding to human epidermal growth factor receptor (HER-2/neu) expression of breast carcinoma. Out of the 171 images corresponding to ER expression images, 104 were negative and 67 were representing positive cases. Out of the 214 images corresponding to HER-2/neu expression images, 112 were negative and 102 were representing positive cases. For the quantification of the staining expression, an in-house developed image analysis software named ‘TissueQuant’ was used, which works on the set of images and generates an Excel sheet with the relevant color scores. These color scores along with other parameters were passed to a neural network for automation of the classification of images as negative or positive cases.
3. METHOD
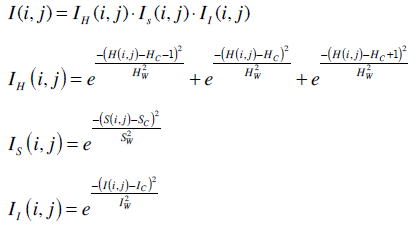
The images were analyzed using the TissueQuant software which was specifically developed for the staining expression quantification. The TissueQuant algorithm works as follows. As a first step, the color image which is represented in the RGB color space is converted into HSI color space. This is done because RGB color space does not represent the colors as perceived by the human eye. The Hue, Saturation and Intensity components of every pixel with coordinates (i, j) are represented as H(i, j), S(i, j) and I(i, j) respectively. These components are studied in comparison with the reference color and are assigned appropriate scores. The formula used for obtaining the score is based on how close the hue, saturation and intensity components are to the hue (Hc) saturation (Sc) and intensity (Ic) components of the color of interest. The widths of the Gaussian weighting functions are decided by the different ranges for the hue (Hw), saturation (Sw) and intensity (Iw) components. These values decide the range of shades of the color which should be given a score. The ER and HER-2/neu expressions take up brown staining for the breast carcinoma positive cells. Hence we choose the centres and widths for hue, saturation and intensity for this color as reference and obtain the Gaussian weighting function to obtain the score for stained pixels.
The score for the pixel at (i, j) is obtained from the weighting functions for the three components as follows. The score for how close the hue of pixel (i, j) is to the reference color is represented as IH(i, j), score for how close the saturation is to the reference color is represented as IS(i, j) and score for how close the intensity is to the reference color is represented as II(i, j). One also has to keep in mind that colors at the end of the hue scale are similar to colors at the beginning of the scale. Therefore, the function IH(i, j) has to wrap around at the limits of the scale. The corresponding equation for a scale [0, 1] is shown below. The cumulative score I(i, j) is given as the product of the three components represented as follows.
The scores for all the pixels were calculated as mentioned above. The mean of the pixel values (Mean) is taken as one feature used for classification. The image with strong response to the hormone expression in a very small area also represents a positive diagnosis. Hence, another feature called Mean-Max is calculated as the mean of the highest fifteen pixel scores which represent strong response to the stain. These features along with the other color features namely hue variance, mean hue and mean saturation were also used for classification. Hue variance is calculated by taking only the hue component of all the pixels and calculating their variance. Mean saturation is obtained by taking the mean of the saturation components of all the pixels. A back propagation neural network was used for the classification of the images into negative and positive cases. These five parameters namely Mean color score, Mean–Max, Hue variance, Mean saturation and Mean hue were fed to the neural network which classifies the cases as negative or positive.
In a feed forward neural network, neurons are arranged in layers, with the first layer taking the inputs and the last layer producing the outputs. Neurons are connected from one layer to the next with different strengths called weights. No connections are allowed between neurons in the same layer. Neurons are not connected to any other neuron beyond those in the next layer. Each neuron in one layer is connected to every neuron in the next layer. This way, the information is fed forward in the network. In the case of feed forward networks, supervised learning algorithms are used for training the network. In this case, a back propagation algorithm is used for the training purpose.
The network is trained by presenting the pattern at the input layer. The actual output and the desired output are compared to obtain the error measure. Back propagation algorithm then modifies the weights of the connections between the neurons so as to minimize this measure.
For the classification of HER-2/neu expression images, a feed forward backpropagation network with 2 layers as shown in Fig. (3), was used. 150 images out of which 78 representing negative and 72 representig positive cases were used for training the neural network. 64 images out of which 34 representing negative and 30 representing positive cases were used for the testing purpose.
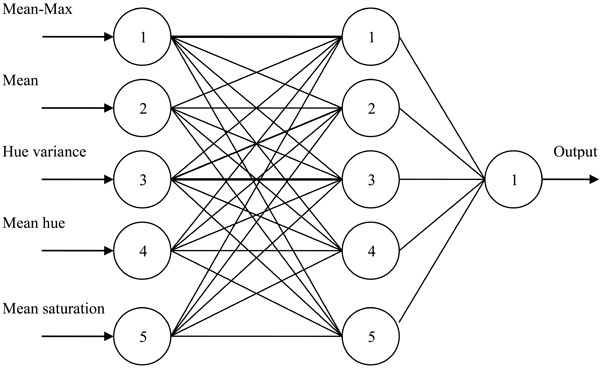 |
Fig. (3). Backpropagation ANN used for classification of HER-2/neu expression images. |
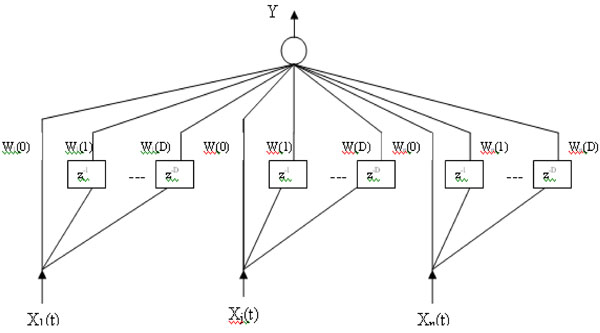 |
Fig. (4). A Timedelay neural network architecture. |
The basic unit of time delay neural network (TDNN) is shown in Fig. (4). In this model, a delay element is introduced as shown in the figure below, represented by z-1. The inputs X1(t),...,XN(t) represent the N dimensions of the vector
 (t) at time t and (D+1) is the number of the successive vectors which define the temporal window size to which the neuron reacts. Each delay element is associated with different weights. Thus each of the N inputs X1(t),...,XN(t), are multiplied by D weights Wj(0),...,Wj(D), (j=1,...,N) and the weighted sum, Y, is passed through the sigmoid function. In this way, a TDNN unit relates and compares current input to the past history of events [21].
For the classification of ER expression images, a time delay backpropagation network with 2 layers having 5 neurons in the first layer was used. 101 images out of which 60 representing negative and 41 representig positive cases were used for training the neural network. 70 images out of which 44 representing negative and 26 representing positive cases were used for the testing purpose.
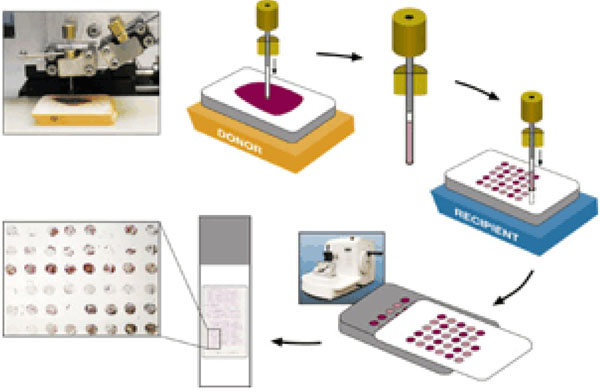 |
Fig. (1). TMA construction (From http://www.tissuearray.org/yale/tisarray.html). |
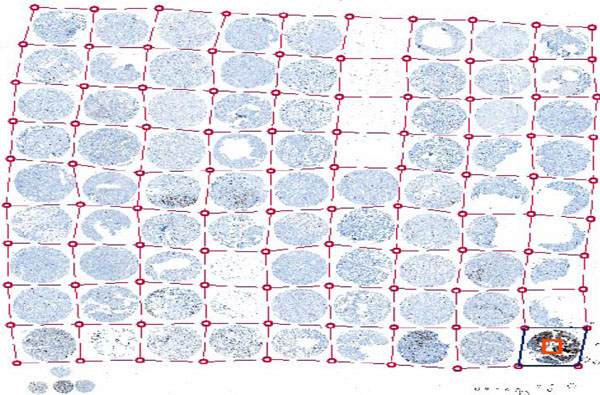 |
Fig. (2). ACIS Grid for automated identification of spots on a slide (From a lecture slide available at http://tmalab.jhmi.edu/docs/Lecksell_TMA_Imaging_And_Analysis_NewJersey_2007.pdf). |
4. RESULTS
The results of classification of the images are summarised in the followig tables. Table 1 shows the results of image classification for the positive and negative cases of ER expression. Similarly, Table 2 shows the results of image classification for the positive and negative cases of HER-2/neu expression. Table 3 shows the details of the training and testing data and the results of classification for both ER expression and HER-2/neu expression images by the neural networks. It can be observed that the neural networks can classify with an accuracy more than 92% in both the cases. Table 4 shows the results of sensitivity, specificity, positive predictive value and negative predictive values of the classification of the ER expression and HER expression images. It can be observed that the neural networks can classify the images with more than 92% sensitivity for both the ER and HER-2/neu expression images.
Results for ER-Expression Image Classification
| Positive | Negative | Total | |
|---|---|---|---|
| Test positive | 24 | 3 | 27 |
| Test negative | 2 | 41 | 43 |
| Total | 26 | 44 | 70 |
Results for HER-2/neu Expression Image Classification
| Positive | Negative | Total | |
|---|---|---|---|
| Test positive | 29 | 4 | 33 |
| Test negative | 1 | 30 | 31 |
| Total | 30 | 34 | 64 |
Image Classification Results for ER and HER-2/neu Expressions
| Number of Data Used for Training | Number of Data Used for Testing | Accuracy (%) | |
|---|---|---|---|
| ER expression | 101 | 70 | 92.86 |
| HER-2/neu expression |
150 | 64 | 92.18 |
Results of Sensitivity, Specificity, Positive Predictive Accuracy and Negative Predictive Accuracy of Classification of ER and HER-2/neu Expression Images
| True Positive | True Negative | False Positive | False Negative | Sensitivity (%) | Specificity (%) | Positive Predictive Value (%) | Negative Predictive Value (%) | |
|---|---|---|---|---|---|---|---|---|
| ER expression | 24 | 41 | 3 | 2 | 92.31 | 93.18 | 88.89 | 95.35 |
| HER-2/neu expression | 29 | 30 | 4 | 1 | 96.67 | 88.24 | 87.88 | 96.77 |
5. DISCUSSION
In this paper we present a system to automate classification of images of immunohistochemically stained tissues for diagnosis of breast cancer. The technique is based on the quantification of the hormone expression. The hormone expression is represented by the brown staining in the stained tissue images. We take into consideration the depth of the color also along with the area to quantify the hormone expression. Our method can classify the images with approximately 90% specificity and above 92% sensitivity.
Automation has been tried at different stages of the TMA process by various groups [22-28]. Automation of construction of TMA has been quite satisfactory. However, most of these studies depend on manual scoring of the images by a pathologist. This is a very laborious process, given the high throughput feature of the TMA technique. The manual evaluation is one of the major bottlenecks of the TMA process flow which affects the time taken for the completion of the study very significantly. In this work, we have attempted to overcome this bottleneck.
Traditional techniques for staining quantification rely solely on subjective visual estimates, yielding only qualitative or at best semi quantitative results. The semi quantitative approach is laborious and time consuming and the evaluation is very subjective. A score ranging from 0 representing no staining, to a score of 4 representing very intensive staining is generally used by most of the pathologists. Distinguishing between the positive and negative results is done by studying the percentage of tumor cells which are positive, the cut off being arbitrarily defined between 5 and 45% [29-32]. Other studies [33-35] have applied semi quantitative scores to assess nuclear staining intensity as a marker of the number of receptors per cell. However, most of these scoring systems are cumbersome and are highly subjective, thus leading to high interobserver variability. In the case of images generated through TMA technique automation of image analysis becomes extremely important so as to match with high throughput of TMA. The high throughput feature of the TMA not only increases the productivity but also provides statistically significant results.
To provide more standardized data for the quantification, diverse computerized image analysis systems have been employed and were found to correlate well with semi quantitative histological scoring methods and with biochemical data [36-38]. However, these suffer from high cost and complexity due to the need for software and specific hardware investments. Hence, the use of these systems in the routine diagnostic laboratories is limited [39].
Digital image analysis techniques have been introduced to obtain more objective, reproducible and accurate results. Various kinds of solutions ranging from general purpose and inexpensive software to specific and expensive software are available to quantify the specific substance present. [15] uses the general purpose image processing software named ‘Metaview’ for staining quantification in which suitable threshold values for Red (R), Green (G) and Blue (B) components are selected to choose the stained area. The area representing positively stained region gives the measure of the substance under study. [16] and [17] make use of Lucia software in which quantification of stain is based on the measure of optical density. [19] uses threshold and area measurement approach. Some more image analysis systems which are available to do this task are BioQuant Nova Prime, Image Pro Plus (Media Cybernetics) and EMPIX Imaging solutions. BioQuant Nova Prime is an advanced image analysis tool designed for biomedical research. An automated microscope slide analysis tool named Ariol SL 50, uses three bright field filters to acquire monochrome images and applies cell masking templates to perform area analysis. Analysis of images in all these applications is based on either threshold and area measurement or the change in optical density. Moreover, selecting appropriate R, G and B thresholds to suitably select shades of a particular color is not always possible. When the substance under study is present in lower concentrations, it stains with lighter shades and when present at higher concentrations it stains with stronger shades. Some other components present in the specimen other than the substance under study could also take up a small degree of staining. Thus, it is important to detect weak specific staining while rejecting non-specific staining to avoid false positive detections. In such cases, the approach of threshold and area measurement fails. Also, when a tissue section is studied for a particular substance, other components present in the section may also take up the stain, expressing different colors. Even these kinds of expressions could contribute to the change in optical density. Hence, there is a need to eliminate such contributions from other components of the tissue section and hence the change in optical density can not be a suitable measure of staining expression.
[40] used SAMBA 4000 image analysis system for quantification of hormone receptor expression. In this work, the positive cell surface, and integrated and mean optical densities and the histograms of integrated optical density were compared. [41] developed semi-automatic system to quantify estrogen and progesterone receptor immunoreactivity in human breast cancer. [42] used WinROOF with macroinstructions for analyzing each captured area. [39] used Adobe Photoshop-based image analysis to quantify hormone receptor expression in breast cancer. The feature selection was done with the Magic Wand tool which could reliably select all immunostained nuclei. The nuclear immunostaining index was calculated as difference between nuclear and background immunostaining intensity.
It has been well established that the quantification of hormone receptor expression beyond classifying as positive / negative could be very useful in providing more insight into the disease and the survival analysis [43]. Many studies have used the positive vs negative modes of evaluation based on arbitrary cut off of percentage of stained nuclei for survival analysis. However, some groups have used subjective scoring of nuclear intensity for survival analysis [33,44]. DeSombre et al. in [45] report that correlation between nuclear staining of ER and both disease-free and overall survival is statistically significant. Reiner and co-workers [33] showed that those patients had the best prognosis in whom nuclear immunostaining of ER was strongest. Esteban and co-authors [46] showed that immunostaining intensity could discriminate groups of patients with statistically different risks for disease relapse and death using a dedicated image analysis system for quantification of immunocyto-chemical studies [39].
The proposed image analysis system evaluates the intensity of the hormone expression based on the color scores provided by the TissueQuant algorithm, which is used to classify the cases as positive or negative. As an extension of this work, it would be useful to evaluate the color scores provided by the TissueQuant algorithm to correlate with the prognosis and survival analysis.
6. CONCLUSION
Through this work, a method for efficient datamining of pathological images for diagnosis of breast cancer from tissue microarray technique is discussed. Tissue microarray provides such a high throughput that handling them individually is quite laborious. Also, it is observed that the analysis phase in the TMA workflow is where the maximum time is spent. This work proposes to automate the classification of images by applying image analysis algorithm to quantify the ER and HER-2/neu antigen expression in the images and thus classify the images into negative or positive cases. In the present work, we have considered the images representing the ER and HER-2/neu expressions evaluation for breast carcinoma cases. The same approach could be used for other studies based on immunohistochemical stains in which the antigen expression could be evaluated based on staining intensity. For this work, we used a total of 171 ER expression images and 214 HER-2/neu expression images. We have shown that the proposed method has 92.31% sensitivity and 93.18% specificity for ER classification and 96.67% sensitivity and 88.24% specificity for HER-2/neu classification. This way, this work can contribute to match up with the high throughput of the imaging technology to bring in lot of advancements in the area of medical research.
REFERENCES
| [1] | Almasri NM, Hamad MA. Immunohistochemical evaluation of human epidermal growth factor receptor 2 and estrogen and progesterone receptors in breast carcinoma in Jordan Breast Cancer Res 2005; 7: R598-604. |
| [2] | Website of University of Pittsburgh Cancer Institute, Tissue MicroArray (TMA) Laboratory Available from: http://www.upci. upmc.edu/tarps/index.cfm [Accessed on 25.08.2009]; |
| [3] | Kononen J, Bubendorf L, Kallioniemi A, Barlund M, et al. Tissue microarray for high-throughput molecular profiling of tumor specimens Nat Med 1998; 4: 844-7. |
| [4] | Shergill SI, Arya M. Tissue microarrays Expert Rev Mol Diagn 2004; 4(4): 421-3. |
| [5] | Venkataraman G, Ananthanaranayanan V. Tissue microarrays: Potential in the Indian subcontinent Indian J Cancer 2005; 42(1): 9-14. |
| [6] | Packeisen J, Korsching E, Herbst H, Boecker W, Buerger H. Demystified... Tissue microarray technology J Clin Pathol: Mol Pathol 2003; 56: 198-204. |
| [7] | Homepage of ACIS system of Chromavisoin: Product description Available from: http://www.bioresearchonline.com/product.mvc/ Automated-Cellular-Imaging-System-0002 [Accessed on 25.08.2009]; |
| [8] | Shaknovich R, Celestine A, Yang L, Cattoretti G. Novel relational database for tissue microarray analysis Arch Pathol Lab Med 2003; 127: 492-. |
| [9] | Liu CL, Prapong W, Natkunam Y, Alizadeh A, et al. Software tools for high-throughput analysis and archiving of immunohistochemistry staining data obtained with tissue microarrays Am J Pathol 2002; 161: 1557-65. |
| [10] | Camp RL, Charette LA, Rimm DL. Validation of tissue microarray technology in breast carcinoma Lab Invest 2000; 80: 1943-9. |
| [11] | The TMAJ Software Project. Website of John Hopkins University Available from: http://tmaj.pathology.jhmi.edu/ [Accessed on 25.08.2009]; |
| [12] | Heyer LJ, Moskowitz DZ, Abele JA, Karnik P, et al. MAGIC Tool: integrated microarray data analysis Oxford Univ J 2005; 21(9): 2114-5. |
| [13] | Liu X, Minin V, Huang Y, Seligson DB, Horvath S. Statistical methods for analyzing tissue microarray data J Biopharm Stat 2004; 14(3): 671-85. |
| [14] | Nielsen TO, Hsu FD, O'Connell JX, et al. Tissue microarray validation of epidermal growth factor receptor and SALL2 in synovial sarcoma with comparison to tumors of similar histology Am J Pathol 2003; 163: 1449-56. |
| [15] | Diaz Encarnacion MM, Griffin MD, Slezak JM, et al. Correlation of quantitative digital image analysis with the glomerular filtration rate in chronic allograft nephropathy Am J Transplant 2004; 4(2): 248. |
| [16] | Pauschinger M, Knopf D, Petschauer S, et al. Dilated cardiomyopathy is associated with significant changes in collagen Type I/III ratio Circulation 1999; 99: 2750-6. |
| [17] | Soukupova J, Albrechtova J. Image analysis - tool for quantification of histochemical detections of phenolic compounds, lignin and peroxidases in needles of Norway spruce Biol Plant 2003; 46(4): 595-601. |
| [18] | Puolakkainen PA, Brekken RA, Muneer S, Sage EH. Enhanced growth of pancreatic tumors in SPARC-Null Mice is associated with decreased deposition of extracellular matrix and reduced tumor cell apoptosis Mol Cancer Res 2004; 2: 215-4. |
| [19] | Niendorf A, Rath M, Wolf K, et al. Morphological detection and quantification of lipoprotein (a) deposition in atheromatous lesions of human aorta and coronary arteries Virchows Arch Pathol Anat 1990; 417: 105-1. |
| [20] | De Boer WI, Hiemstra PS, Sont JK, et al. Image analysis and quantification in lung tissue Clin Exp Allergy 2001; 31: 504-8. |
| [21] | Jedra M, El Khattabi N, Limouri M, Essaid A. Recognition of seed varieties using a time-delay neural network: analysis of electrophoretic images Comput Electron Agric 1999; 22(1): 1-10. |
| [22] | Lingle WL, Riehle DL, Lohse CM, Murphy LL, et al. Automated image analysis for the quantification of immunostains in prostate tissue microarrays Proc Am Assoc Cancer Res 2004; 45. |
| [23] | Bova G. Web-based tissue microarray image data analysis: Initial validation testing through prostate cancer Gleason grading Hum Pathol 2001; 32(4): 417-27. |
| [24] | Takikita M, Chung JY, Hewitt SM. Tissue microarrays enabling high-throughput molecular pathology Curr Opin Biotechnol 2007; 18(4): 318-25. |
| [25] | Romero E, Thallinger GG, Baumgartner K, et al. TAMEE: data management and analysis for tissue microarrays BMC Bioinformatics 2007; 8: 81. |
| [26] | Hsu FD, Nielsen TO, Alkushi A, et al. Tissue microarrays are an effective quality assurance tool for diagnostic immunohistochemistry Mod Pathol 2002; 15(12): 1374. |
| [27] | Della Mea V, Bin I, Pandolfi M, Di Loreto C. A web-based system for tissue microarray data management Diagn Pathol 2006; 1: 36. |
| [28] | Marinelli RJ, Montgomery K, Liu CL, et al. The Stanford tissue microarray database Nucleic Acids Res 2008; 36: D871-7. |
| [29] | Raymond WA, Leong AS. Oestrogen receptor staining of paraffin-embedded breast carcinomas following short fixation in formalin: a comparison with cytosolic and frozen section receptor analyses J Pathol 1990; 160: 295-303. |
| [30] | Pertschuk LP, Feldman JG, Kim Y-D, et al. Estrogen receptor immunocytochemistry in paraffin embedded tissues with ER1D5 predicts breast cancer endocrine response more accurately than H222Sp-gamma in frozen sections or cytosol-based ligand-binding assays Cancer 1996; 77: 2514-9. |
| [31] | Molino A, Micciolo R, Turazza M, et al. Estrogen receptors in 699 primary breast cancers: a comparison of immunohistochemical and biochemical methods Breast Cancer Res Treat 1995; 34: 221-8. |
| [32] | Veronese SM, Barbareschi M, Morelli L, et al. Predictive value of ER1D5 antibody immunostaining in breast cancer Appl Immunohistochem 1995; 3: 85-90. |
| [33] | Reiner A, Neumeister B, Spona J, Reiner G, Schemper M, Jakesz R. Immunocytochemical localization of estrogen and progesterone receptor and prognosis in human primary breast cancer Cancer Res 1990; 50: 7057-61. |
| [34] | Remmele W, Schicketanz KH. Immunohistochemical determination of estrogen and progesterone receptor content in human breast cancer. Computer-assisted image analysis (QIC score) vs subjective grading (IRS) Pathol Res Pract 1993; 189: 862-6. |
| [35] | Detre S, Saclani-Jotti G, Dowsett M. A "quickscore" method for immunohistochemical semiquantitation: validation for oestrogen receptor in breast carcinomas J Clin Pathol 1995; 48: 876-. |
| [36] | Auger M, Katz RL, Johnston DA, Sneige N, Ordonez NG, Fritsche H. Quantitation of immunocytochemical estrogen and progesterone receptor content in fine needle aspirates of breast carcinoma using the SAMBA 4000 image analysis system Anal Quant Cytol Histol 1993; 15: 274-80. |
| [37] | Aziz DC. Quantitation of estrogen and progesterone receptors by immunocytochemical and image analyses Am J Clin Pathol 1992; 98: 105-1. |
| [38] | Santeusanio G, Mauriello A, Schiaroli S, et al. Densitometric and morphometric study of immunocytochemical estrogen receptors detection in breast carcinomas Pathol Res Pract 1992; 188: 478-83. |
| [39] | Lehr HA, Mankoff DA, Corwin D, Santeusanio G, Gown AM. Application of photoshop-based image analysis to quantification of hormone receptor expression in breast cancer J Histochem Cytochem 1997; 45: 1559-66. |
| [40] | Charpin C , Andrac L, Habib MC, et al. Immunodetection in fine-needle aspirates and multiparametric (SAMBA) image analysis. Receptors (monoclonal antiestrogen and antiprogesterone) and growth fraction (monoclonal Ki67) evaluation in breast carcinomas Cancer 1989; 63(5): 863-7. |
| [41] | Sharangpani GM, Joshi AS , Porter K , et al. Semi-automated imaging system to quantitate estrogen and progesterone receptor immunoreactivity in human breast cancer J Microsc 2007; 226(Pt 3): 244-55. |
| [42] | Hatanaka Y , Hashizume K, Nitta K, Kato T, Itoh I, Tani Y. Cytometrical image analysis for immunohistochemical hormone receptor status in breast carcinomas Pathol Int 2003; 53(10): 693-9. |
| [43] | Kamby C, Rasmussen BB, Kristensen B. Oestrogen receptor status of primary breast carcinomas and their metastases. Relation to pattern and spread and survival after recurrence Br J Cancer 1989; 60: 252-7. |
| [44] | Esteban JM, Ahn C, Mehta P, Battifora H. Biologic significance of quantitative estrogen receptor immunohistochemical assay by image analysis in breast cancer Am J Clin Pathol 1994; 102: 158-62. |
| [45] | DeSombre ER, Thorpe SM, Rose C, et al. Prognostic usefulness of estrogen receptor immunocytochemical assays for human breast cancer Cancer Res 1986; 46: 4256s-64s. |
| [46] | Esteban JM, Ahn C, Battifora H, Felder B. Predictive value of estrogen receptors evaluated by quantitative immunohistochemical analysis in breast cancer Am J Clin Pathol 1994; 102: S9-12. |