
RESEARCH ARTICLE
Diagnosis of Esophagitis Based on Face Recognition Techniques
Santosh S Saraf *, 1, Gururaj R Udupi2, Santosh D Hajare3
Article Information
Identifiers and Pagination:
Year: 2010Volume: 4
First Page: 58
Last Page: 62
Publisher Id: TOMINFOJ-4-58
DOI: 10.2174/1874431101004020058
Article History:
Received Date: 2/10/2009Revision Received Date: 5/11/2009
Acceptance Date: 18/11/2009
Electronic publication date: 28/5/2010
Collection year: 2010
open-access license: This is an open access article licensed under the terms of the Creative Commons Attribution Non-Commercial License (http://creativecommons.org/licenses/by-nc/3.0/) which permits unrestricted, non-commercial use, distribution and reproduction in any medium, provided the work is properly cited.
Abstract
Face recognition technology has evolved over years with the Principal Component Analysis (PCA) method being the benchmark for recognition efficiency. The face recognition techniques take care of variation of illumination, pose and other features of the face in the image. We envisage an application of these face recognition techniques for classification of medical images. The motivating factor being, given a condition of an organ it is represented by some typical features. In this paper we report the use of the face recognition techniques to classify the type of Esophagitis, a condition of inflammation of the esophagus. The image of the esophagus is captured in the process of endoscopy. We test PCA, Fisher Face method and Independent Component Analysis techniques to classify the images of the esophagus. Esophagitis is classified into four categories. The results of classification for each method are reported and the results are compared.
INTRODUCTION
Medical Decision Support Systems have been evolving with the advances in the technologies in the related fields. The Decision is based on various forms of data like text, image, video and signals. The analysis and feature determination with the various forms of data have allowed the Medical Diagnosis field to incorporate them for efficient diagnosis.
Face Recognition field has evolved since the reporting of the PCA method [1]. Literature reports a number of algorithms based on PCA, which form the basis of numerous studies in the psychological and algorithmic approaches [2-6]. The face recognition algorithms have been focusing on accurate recognition of the face under various conditions like lighting, face pose, tilt and possible changes in features of the face due to aging [7]. In Medical Imaging field, the process of extracting the features is a general approach. The major task is to design a classifier with the determined features. The classifier performance greatly depends on the type of features and the input dimensions of features. There are numbers of methods [8-9] suggested to reduce the input dimensions of the classifier with an attempt to improve the classification efficiency. One of the statistical methods in reduction of dimension is PCA method which greatly reduces the dimensionality of the data set while retaining the majority of the variation present in the data set. The combination of PCA and Linear Discriemnant tries to group the data for better classification. The Independent Compo-nent method approach tries to get better classification by modeling data as Independent components.
In this paper we report the use of Face Recognition Techniques for classification of Esophagitis. Esophagitis is a condition of inflammation of the Esophagus. The condition is detected in the process of endoscopy of the Upper GastroIntestinal (GI) tract. The Upper GI tract consists of three organs namely the Esophagus, Stomach and the Duodenum . The condition of Esophagitis occurs due to inflammation and subsequent erosion of the esophageal mucosa. On the onset of Esophagitis the subject complains of heart-burn during intake of food [10]. The most common cause is gasteroesophageal reflux (GRED) [11]. The onset maybe due to laxity of the lower esophageal sphincter (LES) that separates the stomach and the esophagus (Fig. 1) wherein the contents of the stomach at a pH level of 2-4 escape into the esophagus area with a pH level of 6-7 or due some drug induced inflammation. Some studies investigate lifestyle traits to study the onset of Esophagitis [12]. The guidelines for the most commonly occurring Esophagitis is listed in [13]. The process of endoscopy facilitates observation of the internal mucosa of the GI tract. The observation helps the expert to arrive on the diagnosis [14].
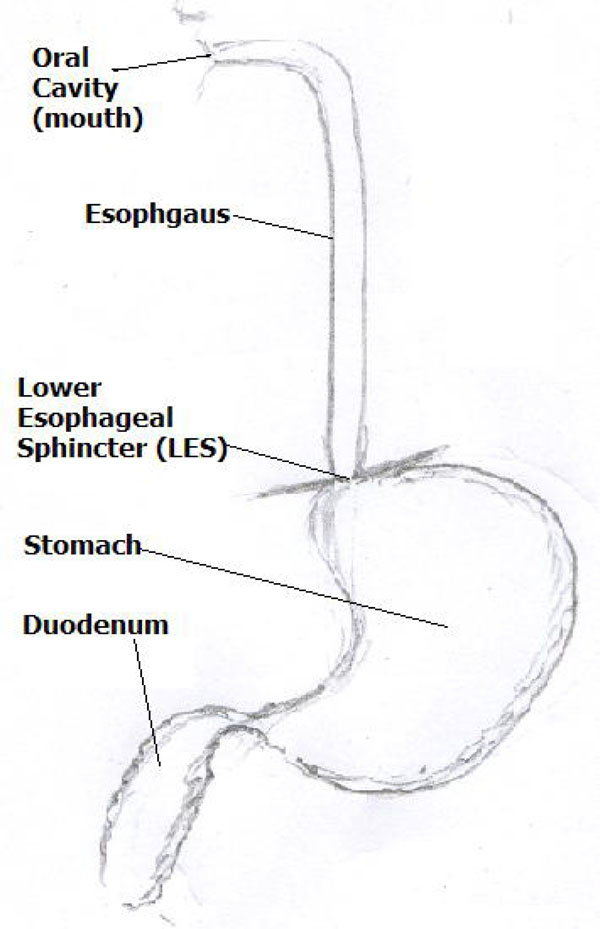 |
Fig. (1). Upper GI Tract (the junction of esophagus and stomach is LES). |
The process of endoscopy generates a lot of images which form as good source to test the algorithms. There are two popular methods of Classification – 1) Savary-Miller Method [15] and 2) Los Angeles Classification method [16]. The Savary- Miller method classifies Esophagitis in four grades Grade I, II, III and IV based on the inflammatory lesions. The severity of Esophagitis increases with the grade. The Los Angeles method is based on the extent of mucosal breaks and the spread on the esophageal circumference. The method classifies Esophagitis in four grades namely Grade A, B, C and D. The mucosal break and its spread over the circumference of the esophagus increases from Grade A to Grade D. We will be adopting the Savary-Miller Method. Results on the following three popular algorithms are reported namely PCA (Eigen face method), Fisherface (PCA-LDA) method [17] and Independent Component Analysis (ICA) [18] techniques to classify the images of the esophagus. The results of classification for each method are reported and the results are compared.
The rest of the paper is organized as follows : the Materials and Methodology section will explain the process of data collection, data labeling, details of the algorithms and their implementation. In the Results section we report the classification results of each of the methods. In the Discussion section we compare the results by these methods. In the Conclusion section we conclude by commenting on the technologies and its efficacy for the domain of application.
MATERIALS AND METHODOLOGY
The images of esophagus are captured in the process of endoscopy. The images are categorized into four categories namely in four grades Grade I, II, III and IV based on the inflammatory lesions of esophagus. The Grade IV comes under the category of severe Esophagitis involving bleeding. We consider only Grade I, II and III, the fourth category being the Normal Esophagus (Fig. 2). The images are segregated and each Grade image is treated as image of a person with different pose and feature variation. Therefore we have four faces to recognize/classify.
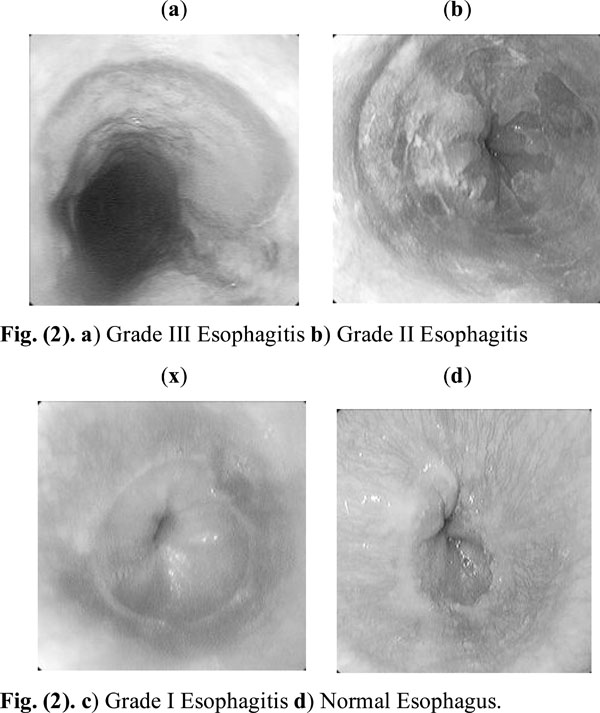 |
Fig. (2). |
Seventy images per category are saved and they are subjected to the process of face recognition algorithms with varying train and test ratios. The Algorithms tested are PCA (Eigen Face) method, PCA- Linear Discriminate Analysis (Fisher Faces) method and ICA method. The details of the algorithms follows.
Principal Component Method (PCA)
PCA is one of the earliest methods suggested in Face Recognition techniques. The method also serves as a benchmark for performance on any new techniques proposed. It is popularly known as eigen face method. PCA is statistical method used for reduction of dimensions of a given dataset. The essence of the dataset is represented by principal components. In face recognition PCA reduces the dimensions by exploiting the similarities between images. The process of PCA is discussed below
- The first step is to obtain a set S with M images of esophagus. We assume a test and train ratio of 70:30, 70 % of the images in the data set are considered. Each image is transformed into a vector of size N and placed into the set.
The mean image ψ is obtained by apply the formula listed in (2)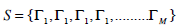
(1) 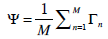
(2) - The difference Φi between the input image and the mean image is determined

(3) - Next we seek a set of M orthonormal vectors, un, which best describes the distribution of the data. The kth vector, uk, is chosen such that
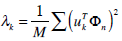
(4)
The equation (5) evaluates to one if l=k, zero otherwise.
(5)
Note: µk and λk are the eigenvectors and eigenvalues of the covariance matrix C. - We obtain the covariance matrix C in the following manner ‘
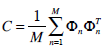
(6) 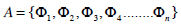
(7) - Since the C matrix is an N2 x N2 matrix, computing its eigenvectors is not computationally feasible. Instead, we find the eigenvectors vl of the new matrix
L = ATA which has the same eigenvectors of our matrix C = AAT
(8) - Once we have found the eigenvectors, vl, of the L matrix, we can find our eigenfaces ul
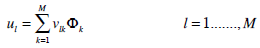
(9)
Recognition/Classification Procedure
- A new face is transformed into its eigenface components. First we compare our input image with our mean image and multiply their difference with each eigenvector of the L matrix. Each value would represent a weight and would be saved on a vector Ω.
where ω = weight, μ = eigenvector, Γ = input image, Ψ = mean face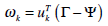
(10)
The weight vector is given by
(11) - We now determine which face class provides the best description for the input image. This is done by minimizing the Euclidean distance

(12) - The distance between the test image and the training set is computed. The minimum distance is determined and the test image belongs to the class which has minimum distance from the training set class.
The efficiency of classification and the confusion matrix for this method is reported in the Results section.
Fisherfaces Method (PCA-LDA Method)
Developed in 1997 by P. Belhumeur et al., The method is based on Fisher’s Linear Discriminant Analysis is faster than eigenfaces, in some cases, has lower error rates, works well even if different illumination, works well even if different facial express. LDA seeks directions that are efficient for discrimination between the data. Fisher method tries to shape the scatter to have efficient classification. The method maximizes the ratio of the between-class scatter and the within-class scatter.
The procedure for the fisherface method is discussed below
- The first step is to obtain a set S with M images of esophagus. We assume a test and train ratio of 70:30, 70 % of the images in the data set are considered. Each image is transformed into a vector of size N and placed into the set.
The mean image Ψ is obtained by apply the formula listed in (14)
(13) 
(14) - Compute the average of each class and subtract them from the training images.
- The between-class scatter matrix is defined as
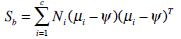
(15)
where µi is the mean image of class Xi and Ni is the number of samples in the class Xi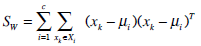
(16)
The Fisherface method creates a set of projection vectors by using these scatter matrices to maximize between-class measure while simultaneously minimizing within-class scatter, thus yielding superior results. This is illustrated in the results section.
Independent Component Analysis
Independent component analysis (ICA) is a method for finding underlying factors or components from multivariate (multi-dimensional) statistical data. What distinguishes ICA from other methods is that it looks for components that are both statistically independent, and nonGaussian. While PCA seeks directions that represent data best in a
 sense, ICA seeks such directions that are most independent from each other.
ICA does not require the orthonormalization of vectors, which allows higher-order dependencies in image pixels. ICA removes the first and second order statistics by sphering the data, the process makes the data uncorrelated. Each image is stored as a row vector in X, which is multiplied by the whitening matrix Wz =2cov(X)1/2. Whitening is a process that transform the observed vector X linearly so that we obtain a new vector  which is white, i.e. its components are uncorrelated and their variances equal unity. In other words, the covariance matrix of equals the identity matrix:
 |
(17) |
ICA finds statistically independent images, represented by the rows in the matrix A, that are mixed together with matrix W such that A = WX. The rows are analogous to eigen faces and columns of W-1 are weights of each image. The amount of computation makes the ICA process slow compared to the PCA and Fisherface method.
RESULTS
Based on the expert opinion, the images of esophagus were segregated in four classes namely Grade I, Grade II, Grade III Esophagitis and Normal Esophagus. We have seventy images in each class. The dataset is split into train:test ratio. The first phase is training and the second phase is testing. After each run the classification efficiency is determined. The results for the mentioned algorithm are illustrated in the Table 1. The classification efficiency is based on the confusion matrix determined after each test run. The confusion matrix is a visualization tool predictive analysis [19]. A typical confusion matrix for two class classifier is shown in (Fig. 3). The following parameters can be determined from the confusion matrix –
Classification Efficiency for the Mentioned Algorithms with Varying Test:Train Ratio
| Sl. No. | Algorithm | Train:Test Ratio | % Classification Efficiency |
|---|---|---|---|
| 1 | PCA | 60:40 | 75 |
| 2 | ICA | 60:40 | 74 |
| 3 | PCA-LDA | 60:40 | 80 |
| 4 | PCA | 70:30 | 77 |
| 5 | ICA | 70:30 | 76 |
| 6 | PCA-LDA | 70:30 | 90 |
 |
Fig. (3). Confusion Matrix for two class classifier. |
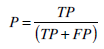
From the figure the parameters are as follows -True Positive (TP) is classifier reporting the same label as known label, False Negative (FN) is classifier reporting negative even if the sample is labeled positive, False Positive (FP) is classifier reporting as positive even though the sample is negative, True Negative (TN) confirming that the label does not belong to that class. The parameters that can be determined by the confusion matrix are as follows-
- Precision (P): The percentage of positive prediction that are correct (18)
(18) - Recall/ Sensitivity (Se): The percentage of positive labeled instances that were predicted as positive (19).

(19) - Specificity (Sp): The percentage of negative labeled instances that were predicted as negative (20).

(20) - Accuracy (A): the percentage of predictions that were correct (21).
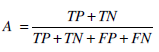
(21)
The specificity and sensitivity parameter for each method is shown in Table 2.
Specificity (Sp) and Sensitivity (Se) for the Mentioned Algorithms with Varying Test:Train Ratio. (Sp x100%, Se x 100%)
| Sl. No. | Algorithm | Train: Test Ratio | Normal | Grade I | Grade II | Grade III | ||||
|---|---|---|---|---|---|---|---|---|---|---|
| Sp | Se | Sp | Se | Sp | Se | Sp | Se | |||
| 1 | PCA | 60:40 | 0.95 | 0.35 | 0.87 | 0.53 | 0.80 | 0.64 | 0.88 | 0.81 |
| 2 | ICA | 60:40 | 0.95 | 0.57 | 0.94 | 0.85 | 0.89 | 0.71 | 0.94 | 0.85 |
| 3 | PCA-LDA | 60:40 | 0.98 | 0.65 | 0.96 | 0.71 | 0.91 | 0.78 | 0.85 | 0.90 |
| 4 | PCA | 70:30 | 0.93 | 0.48 | 0.93 | 0.81 | 0.87 | 0.80 | 0.94 | 0.82 |
| 5 | ICA | 70:30 | 0.98 | 0.62 | 0.93 | 0.77 | 0.87 | 0.72 | 0.89 | 0.81 |
| 6 | PCA-LDA | 70:30 | 0.96 | 0.85 | 0.97 | 0.81 | 0.93 | 0.86 | 0.97 | 0.91 |
DISCUSSION
From the results it is observed that the PCA-LDA method has the highest efficiency and it improves with the increasing ratio of training. The amount of time required for classification is largest in ICA method and significantly low in PCA and PCA-LDA method. The efficiency shown in Table 1 is for the overall efficiency of the classification. It is illustrated that the Specificity (Sp) and Sensitivity (Se) values are high for Grade II and Grade III type for Esophagitis and the values are highest for PCA-LDA method, thus justifying the result for maximizing the between-class measure while simultaneously minimizing within-class scatter.
The motivation for the study is based on the paper on the study conducted for classification of White Blood Cells using Eigen method [20]. The paper reports classification percentage of various blood cells in the range 90% to 100%. The comparative study of various methods as applied to face recognition with application to face book is presented in [21]. The Face Evaluator a package implemented using MATLAB has been extensively used for this paper. Literature reports use of PCA for semantic based image retrieval system [22] that can discriminate between images differing only through subtle, domain specific cues, which is a characteristic feature of many medical images. The efficient retrieval of images also reflects on the goodness of the feature set selected. These experiments help to get better feature sets which can be used to train either a Neural Network or a Support Vector Machine to get better classification. The classification using the statistical method is also dependent on the distance measure used in the classification [23].
CONCLUSION
Based on the results it can be seen that with proper choice of train and test ratios, the method is suitable for classification. This method can be modified to display the images to which the test image is nearest. This feature will include the explanation for the classification. This is a requirement for the Decision Support System. The disadvantage being that with the dataset increasing the amount of memory required increases. This can be taken care by periodically, updating the database by discarding the least significant images.
A complete system with a User Interface can be proposed with tools to manage the training set, with a facility to do away with the images which do not significantly help the process of classification, effectively reducing the dataset required for efficient classification.