
RESEARCH ARTICLE
Preliminary Characterization of Erythrocytes Deformability on the Entropy-Complexity Plane
Ana M Korol1, 2, Mabel D’Arrigo1, Patricia Foresto1, Susana Pérez1, Maria T Martín3, Osualdo A Rosso*, 4, 5
Article Information
Identifiers and Pagination:
Year: 2010Volume: 4
First Page: 164
Last Page: 170
Publisher Id: TOMINFOJ-4-164
DOI: 10.2174/1874431101004010164
Article History:
Received Date: 18/09/2009Revision Received Date: 02/02/2010
Acceptance Date: 12/06/2010
Electronic publication date: 1/9/2010
Collection year: 2010
open-access license: This is an open access article licensed under the terms of the Creative Commons Attribution Non-Commercial License (http://creativecommons.org/licenses/by-nc/3.0/) which permits unrestricted, non-commercial use, distribution and reproduction in any medium, provided the work is properly cited.
Abstract
We present an application of wavelet-based Information Theory quantifiers (Normalized Total Shannon Entropy, MPR-Statistical Complexity and Entropy-Complexity plane) on red blood cells membrane viscoelasticity characterization. These quantifiers exhibit important localization advantages provided by the Wavelet Theory. The present approach produces a clear characterization of this dynamical system, finding out an evident manifestation of a random process on the red cell samples of healthy individuals, and its sharp reduction of randomness on analyzing a human haematological disease, such as β-thalassaemia minor.
INTRODUCTION
Fractal analysis has been applied with great success to many different biological systems, and many of them have been found to be either spatial or temporal fractals [1]. The present model of erythrocytes (blood cells) viscoelastic properties is another example of a temporal fractal in biological systems. The clinical interpretation of erythrocyte deformation attempts to link pathological features with the visual microscopy inspection of erythrocyte samples. It is well known that on healthy donors the erythrocytes are discocytes which is the dynamical expression of the best capability of the cells to be able to adapt in flow. Human red blood cells are viscoelastic, showing viscous and elastic components integrated in a complex viscoelasticity when undergo fluid shear stress. This dynamic behaviour has a physiological significance since in vivo the erythrocytes continually change their shape and adapt passively to capillary circulation. The objective of the present work is to investigate and characterize different populations of red blood cells subjected to fluid shear stress, by means of Information Theory tools, in particular by the use of the Entropy-Complexity plane.
Our preliminary studies on red blood cells (RBC) complex behaviour [2-6], have shown the competition between stochastic ordinal Brownian motion (oBm) and fractional Brownian motion (fBm), and deterministic behaviour and makes a crossover from one relaxation scenario to the other subjected to shear stress. On this basis we applied a new concept in the study of the manifestation of this behaviour. We introduce Wavelet based Information Theory quantifiers: the Normalized Total Shannon Entropy, the Martín-Plastino-Rosso (MPR) Statistical Complexity and in particular the complexity-entropy plane [7-9], to find out the evident manifestation of a random process on the red cell samples of healthy individuals (controls), and its sharp reduction of randomness on analyzing a human haematological disease, such as β-thalassaemia minor.
β-thalassaemia syndromes constitute an heterogeneous group of genetic alterations characterized by deficient or absence synthesis of β-globin chain [10]. Heterozygous β-thalassaemia is associated with morphological changes consisting of microcytosis, decreased red blood cells haemoglobin concentration, and high haemoglobin A2 levels. Rheological studies in β-thalassaemia carriers suggest the existence of decreased red cell deformability [11]. However, to our best knowledge, there are no reports on thalassaemia erythrocytes complexity quantification using these novel quantifiers. So far, the wavelet based complexity-entropy plane of erythrocytes performed by laser diffractometry could be very useful to investigate the cell membrane alterations.
MATERIALES AND METHODS
Blood Samples
Samples were obtained by cubital venipuncture with disposable syringes and large gauge needles to avoid mechanical cell damage [12], using as anticoagulant Na2EDTA, in 19 individuals: 14 β-thalassaemia patients, 5 healthy controls. Healthy controls were non-smokers, non-alcoholic individuals and were not receiving any therapeutic drug. Thalassaemia patients were diagnosed as β-thalassaemia minor by conventional methods and classified by molecular biological ones (PCR-ARMS) as β0 (β0 39). Anticoagulated blood samples were kept at 5 ºC. Rheological studies were carried out within the first four hours after withdrawal to avoid cell membranes damage. All patients and healthy controls gave their informed consent to participate in the study.
Red Blood Cells Suspension and Medium
100 µl of anti coagulated whole blood were suspended into 4 ml of isotonic viscous medium. 5 % w/v polyvinylpyrrolidone (PVP 360, Sigma, MW 360 kDa) in phosphate buffered saline (PBS: 0.150 M NaCl, and 0.005 M (K2PO4 + KPO4H); pH 7.4 ± 0.05; 295 ± 8 mOsmol/kg). Medium viscosity adjusted at 22 ± 0.5 cP at 25 º C.
Experimental Setup
In Fig. (1) an scheme of the home-made erythrodeformeter device is presented. For its validation and reliability we refer the reader to reference [13]. This device allows us to tests the ability of red blood cells to change their circular shape into an ellipsoidal one, when are subjected to a well-controlled fluid shear stress. The erythrodeformeter device has two plane disks, both of them of flint glass, superposed, coaxials, parallels and horizontals. The driving motor is coupled to the lower disk by two helicoidal gears that provide a great rigidity to the transmission system. This allows the rotational disk to start or stop rotation in a short time (< 1 ms), so can be considered as instantaneous.
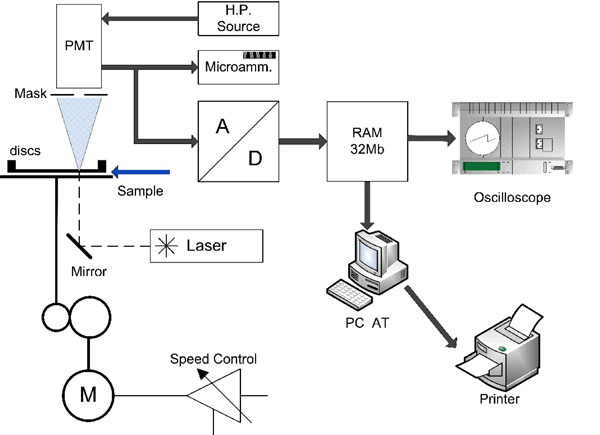 |
Fig. (1). Scheme of the home-made erythrocytes deformeter device. |
The light source is a 5 mW HeNe laser. When the layer of diffracting cells is perpendicularly transversed by the laser beam, the diffraction pattern can be observed on a ground glass screen. Diffracted intensity corresponding to each principal diameter of the elliptical diffraction pattern falls onto a masked photomultiplier tube (PMT), after passing through a thin straight slot in the mask placed exactly on the corresponding axis of the elliptical pattern.
All units, except the oscilloscope and the PC, are home-made equipments. The PMT signal output is either relayed to the microammeter or to the oscilloscope. When the PMT is connected to the microammeter, two values of electrical current can be measured. They correspond to the long and short axis of the elliptical pattern. On the other hand, the PMT is connected to the oscilloscope through an 8-bit A/D converter having a memory divided into 32 sectors with 256 bytes each. The conversion delay is 0:1 ms and the converter board has two important controls which must be adjusted for optimal performance: one selects the memory sector to be filled during the data acquisition, the other selects the lapse of time during which a set of 256 data points will be acquired and stored [2, 3, 14].
Data Acquisition
The erythrocyte suspension is placed between the two flint glass disks, and the driving motor allows the lower disk rotation. Normal erythrocytes being at rest can be considered as a monodisperse population having discoidal shape with almost the same size. Light diffraction under Fraunhofer theory conditions may be applied to obtain quantitative information of diffracting particles such as suspended erythrocytes. The cells in dilute suspension, under shear stress take a three axial ellipsoidal shape having the major axis oriented towards the shear field direction. The laser beam transverses perpendicularly a thin layer of the erythrocytes suspension and it is diffracted producing a Fraunhofer diffraction pattern that is either circular when the cells are at rest or elliptical when they are deformed by a shear stress field. These two typical patterns are shown in Fig. (2). The start of data acquisition is externally triggered by the erythrodeformeter motor switch. Once the driven motor is switched on, the PMT signal output is read, converted and stored in a preselected memory sector. Each time the A/D converter completes a conversion and, as soon as, the creep time series has been stored, it returns to the initial position ready to start a new cycle of conversion and storage of another set of data into a new memory sector. A similar process is carried out when the motor is switched off to store a recovery curve (measured while the cells recover their circular shape from the ellipsoidal one) as well as it was done with the creep one. The A/D converter can receive data from the memory and plot them repeatedly on the oscilloscope screen. A 25-pin connector allows the transfer of data from the A/D converter to the PC by an interfaced bus. Data can be stored in the PC hard disk for being numerically processed offline. Typical time series corresponding to healthy donors and thalassaemic patients are shown in Fig. (3) (50 data points = 147 ms). From this figure it is clear that the signals present non-stationary characteristics. These time series correspond to diffracted intensity measured in the major axis of the elliptical pattern under recovery condition.
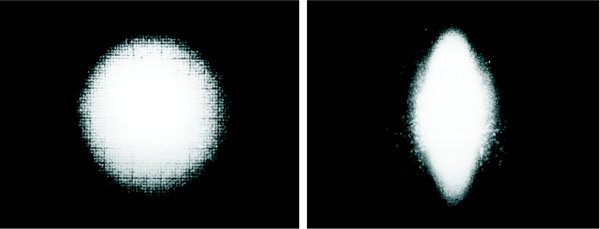 |
Fig. (2). Diffraction pattern of the erythrocyte: circular shape at rest, elliptical shape under well defined shear stress. |
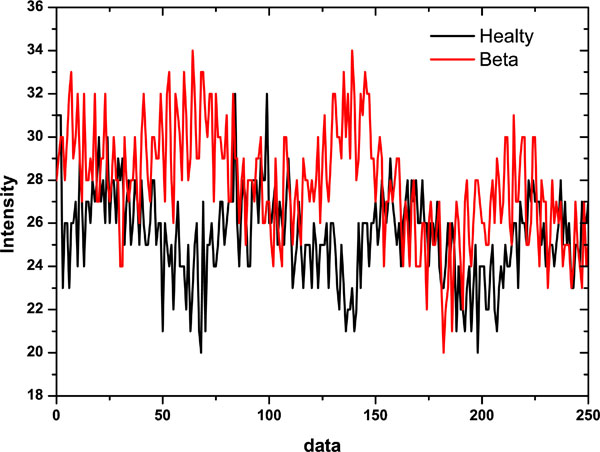 |
Fig. (3). Diffracted intensity measured along the major axis of the elliptical diffraction pattern under recovery condition (typical signals analyzed). |
DATA ANALYSIS
Ascertaining the degree of unpredictability and randomness of a dynamical biological system is not automatically tantamount to be in a position to capture the relationship between the components of the pertinent process. Randomness and structural correlations are not totally independent aspects of the accompanying physical and biological description of the erythrocytes deformation. Moreover, maximal randomness as well as perfect order has complexity zero, so have no structural correlations. In between these two extremes a wide range of possible degrees of physical structures exists that should be found in the behaviour of the underlying probability distribution. Complexity in this sense refers to non equilibrium structures, typically such as erythrocyte viscoelastic behaviour.
In the mathematical characterization of this photometrically recorded time series, we used wavelet analysis that is one of the most useful tools when dealing with natural time series [15, 16]. This method expresses our original experimental time series in terms of a set 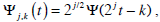 with j, k ∈ Z (the set of integers), of translations and scaling functions of a wavelet mother Ψ. In the case that this family be an orthonormal basis for the space of finite-energy functions, the concept of energy becomes linked with the usual notions derived from Fourier’s theory. The experimental signal obtained with the erythrodeformeter is collected using a uniform time grid. In our numerical analysis we use orthogonal cubic spline functions as the mother wavelet. Among several alternatives the symmetric and orthogonal wavelet basis obtained from it has become a recommendable tool for representing natural signals [17]. The wavelet analysis is carried out over N = 7, frequency resolution levels (denoted by index j, Daubechies’ notation j = −N,...,−1). The wavelet transform allow us a useful characterization of the experimental signal (time series) by the amplitude distribution of the coefficients in the wavelet basis [18, 19]. The j-scale wavelet coefficients family set {Cj(k)} could be interpreted as the local residual errors between successive signal approximations at levels j and j +1. It contains information on the signal S(t) corresponding to the frequencies
  where ws represent the sample frequency.
The energy associated with j-resolution wavelet level, is given by

Summing over all the available wavelet levels j we obtain the total energy

Finally, we define the relative wavelet energy (RWE) as

The relative wavelet energy associated to the different frequency bands enables one to learn about their relative degree of importance. This time-scale probability distribution of energy across the frequency scales, P = {ρj}, constitutes a suitable tool for detecting and characterizing specific phenomena in both time and frequency planes [18, 19]. Then, if one is in possession of a probability distribution, the possibility of applying Information Theory allows us to evaluate specific quantifiers like the Normalized Total Shannon Entropy and the MPR-Statistical Complexity which could give additional information about the dynamical process under study. So we go from the experimental photometrically recorded time series to wavelet Information Theory quantifiers. They could tell us a lot about the viscoelastic properties of the red blood membrane.
Given a probability distribution  we define the normalized Shannon entropy by
H(P) = S[P]/Smax ,
where S[●] denote the Shannon entropy functional form given by
and Smax = ln(M) is the normalization constant, in this way 0 ≤ H ≤ 1.
The MPR-Statistical Complexity [8, 9, 19] is defined as
C[P] = H[P].Qj[P],
where H [P] is a normalized Shannon’ entropy defined above and Qj [P] represents the disequilibrium evaluated in terms of the Jensen-Shannon divergence,
Qj[P]=Q0.Js[P,Pe].
In the previous equation the Jensen-Shannon divergence Js[●,●] represents the distance between the uniform probability distribution Pe = {pi = 1/ M,i = 1,...,M} and P the probability distribution of the accessible states of the system. Q0 is a normalization constant, then 0 ≤ Qj≤1. The disequilibrium would be different from zero if there exists more likely states among the accessible ones, and where our probability distribution is located with respect to the uniform distribution. The Jensen-Shannon divergence for two probabilities P1 and P2 is given by
where P* = (P1 + P2)/2. The quantifiers H and C are normalized quantities and in consequence they are dimensionless.
It should be noted that this complexity measure is not a trivial function of the entropy, in the sense that for a given value of H, there exists a range of complexities between a minimal value Cmin and a maximal Cmax. Then, evaluating the statistical complexity measure provides one with important additional information regarding the peculiarities of a probability distribution. A general procedure for obtaining the complexity bounds is given by Martín, Plastino and Rosso in [20]. In order to study the time evolution of the signal or moreover how it changes according with some intrinsic characteristic parameters, a diagram of CvsH can be used [21-23, 25, 26]. This is the so-called entropy-complexity plane.
RESULTS AND CONCLUSIONS
Complexity refers to certain systems quality of being intricate and hardly predictable, ranging from turbulent flows of the atmosphere to cells behaviour. For succeeding in the plan of explaining complex behaviour, biologist, physicists, mathematics and engineers have been looking for simplified models mathematically tractable and able to catch the essence of complexity. We would like to emphasize the dynamics, not the tools. Analysis based on Fourier Transform of red blood cells deformation photometrically recorded time series has been performed previously (see in example [3]). However, this kind of time series exhibit some degree of non-stationarity and present a small length, making in way difficult the application of this technique in order to obtain reliable results. Wavelet transform do not require stationary condition of the signal under analysis and can be used with small amount of data. The present article applies informational tools derived from the orthogonal discrete wavelet transform and their application to the analysis of red blood cells deformation.
The relative wavelet energy, the first quantifier, provides information from the relative energy bands that are to be found in the photometrically obtained time series while the erythrocytes are subjected to shear stress.
The analyzed time series correspond to the fluctuations of the circular pattern of the erythrocytes for healthy donors (control samples) and heterozygous β-thalassaemic patients. The erythrocytes suspensions were obtained according to the experimental procedure described above and following the International Committee for Standarization on Haemathology [12]. The photometrically recorded time series have a length of 256 datapoints and the corresponding discrete orthogonal wavelet transform (using a spline cubic mother wavelet) were obtained for resolution levels j=–1,...,–7 Taken the wavelet coefficients set {cj(k)}, the energy wavelet based probability distribution P = {ρj}, corresponding to controls and β-thalassaemia were evaluated.
In Fig. (4), the grand average of the energy wavelet based probability distribution for controls and β-thalassaemia are presented. The relative energy bands appear better distributed in the β-thalassaemia patients, than in control samples, which could be a signature of the appearance of chaos on the first ones. The relative wavelet energy on healthy donor samples is greater on levels j =–1,–2,–3, while on β-thalassaemia patient samples the relative wavelet energy is concentrated on levels j =–5,–6,–7. In particular on level j =-7 the relative wavelet energy value on β-thalassaemia patient samples, is important and this behaviour could correspond to a minor entropy.
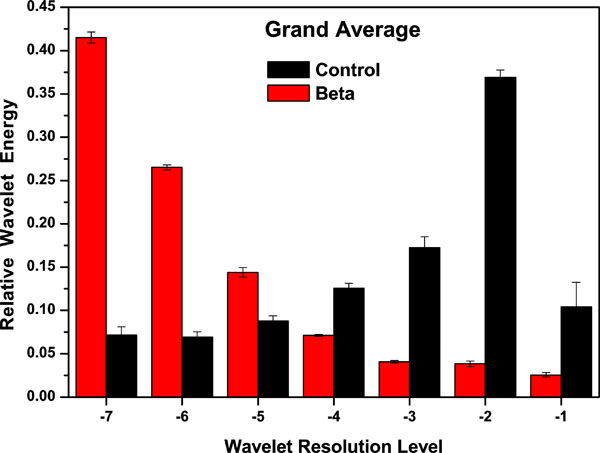 |
Fig. (4). Grand average corresponding to Relative Wavelet Energy (RWE) for 5 healthy controls and 14 β-thalassaemic samples. |
In Fig. (5), we show the Normalized Total Shannon Entropy (H) values obtained for the different samples studied in the present work. We observed that the wavelet entropy averaged values for control samples is <H(c)>=0.91, this value could be related to homogeneous discocytes samples which is the dynamical expression of the cell capability of changing their shape in flow. On the other hand the entropy values for β-thalassaemia patients have an averaged value of < H(β) >= 0.785240. This decrease in the mean value could be caused by the loss of viscoelasticity in some cells and could be associated with acanthocyte and dacrocyte cells in the samples. This is compatible with the fact that all the patients studied were β-thalassaemia minor, so they do not need to receive blood transfusion and their population of erythrocytes is constituted by healthy and damaged cells. We have to remark that all the entropy values, H(c), for controls are higher than the corresponding entropy values, H(β), corresponding to β-thalassaemia patients; there are two clouds of points for each population of samples; and they are clearly differentiated.
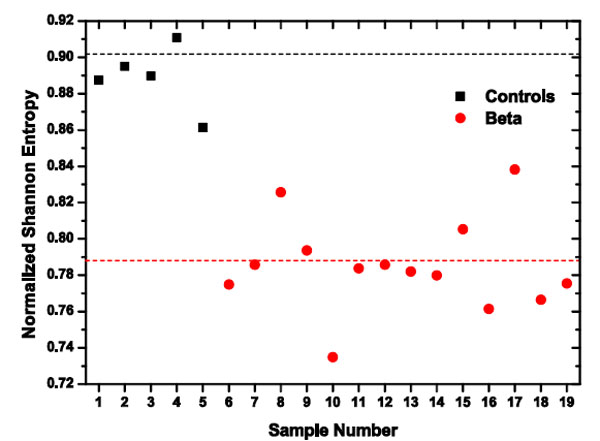 |
Fig. (5). Two clearly different clouds for each population: healthy donors (black), and β-thalassaemia patients (red). The horizontal lines correspond to the average Normalized Shannon Entropy values. |
The MPR-Statistical Complexity (C) values obtained for the different samples analyzed are presented in Fig. (6). Note that the averaged complexity values for β-thalassaemia patients is < C(β) >=0.1725407, while for control samples population is < C(c) >=0.083, this reduction on the MPR-Statistical Complexity reflects the interplay between its disequilibrium and the amount of information stored in the red blood cells deformability dynamics. This information measure quantifies aspects of the intricate structures hidden in the photometrically recorded series of red blood cells. In the group of control samples, the erythrocytes are constituted by healthy cells, while in the group of β-thalassaemia patients, the erythrocytes are constituted by healthy and damaged cells. Moreover, < C(β) > is not only higher than < C(c) > but also all the values obtained for control samples are smaller than the ones obtained for β-thalassaemia patients. The statistical complexity measure quantifies not only randomness but also the degree of correlation structures [25, 26]. As we said before, it is not a trivial function of the entropy because for a given H- value, there exists a range of possible C-values between a Cmin and Cmax [20]. Then, evaluating the MPR-Statistical Complexity, C , provides one with very important additional information about the peculiarities of the probability distribution, that it is not already carried by the entropy measure.
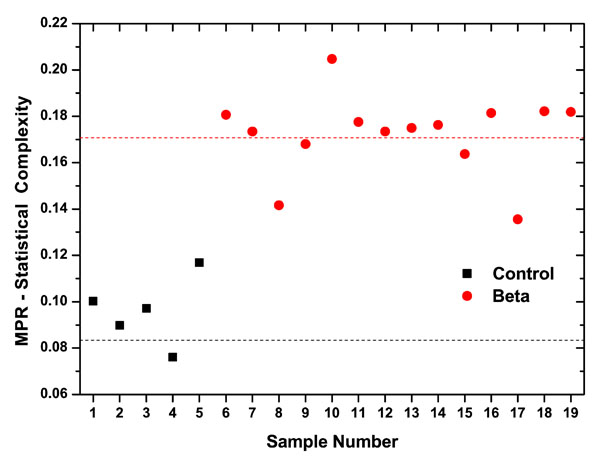 |
Fig. (6). Two clearly different clouds for each population: healthy donors (black), and β-thalassaemia patients (red). The horizontal lines correspond to the average Normalized Shannon Entropy values. |
In order to study the changes in the dynamics of the system under study, a diagram of CvsH can be used, which is the so-called complexity entropy plane [21-26]. In Fig. (7) we display our results in this plane. As mentioned previously (see Sec. 3), the corresponding complexity values are bounded by Cmin and Cmax curves evaluated, in this case for N = 7. Their values are displayed in this figure using continuous lines. Only values in the interior of the region defined by these two limit curves can be numerically obtained. All the photometrically recorded series in the present entropy-complexity planes present values that are almost equidistant from the two limit curves; however the localization of the clouds of points corresponding to controls and β-thalassaemia patients are in well differentiated regions.
In Fig. (7) it is clear that our introduced wavelet based informational tools are able to distinguish between the two sample populations. The control samples are more disordered. The dynamics corresponds to white noise, where the maximum values of entropy are reached together with minimum values of complexity. While, the β-thalassaemia patients samples exhibit decreasing entropy values and increasing complexity values, that could correspond to short memory fractional Brownian motion; results consistent with our previous works [5, 23].
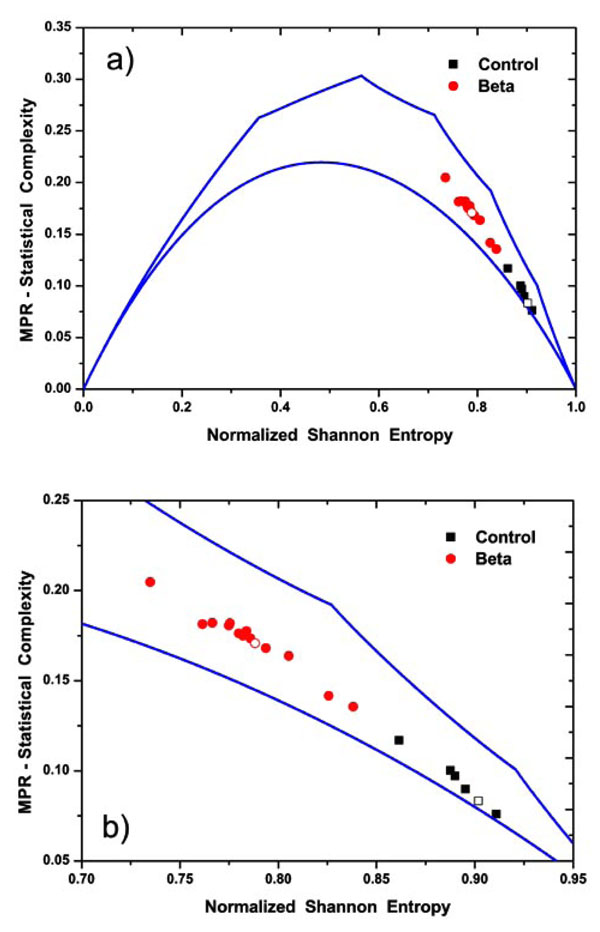 |
Fig. (7). a) Entropy-Complexity plane for N = 7. The continuous lines display the bound curves Cmin and Cmax associated to the maximum and minimum values of complexity for a fixed value of the normalized entropy. Also, different marks are used to distinguish the numerical calculated values for controls and β-thalassaemia signals. The open symbols correspond to the values obtained using the corresponding grand average of Relative Wavelet Energy (see Fig. 4). b) Detail of the Entropy-Complexity plane. |
For the population of control samples we found that in our entropy-complexity plane the pertinent point lies in the high entropy interval, (0.860, 0.911) and low complexity values (0.075, 0125). In fact this behaviour is quite close to the total random expected values corresponding to H = 1 and C = 0. In consequence one can associate an almost random behaviour with low correlation structures presented in the time series. All the photometrically recorded series from β-thalassaemia patients are localized in the entropy-complexity plane in the entropy region lying in the interval (0.735, 0.838) and complexity interval (0.125, 0.225). This decrease in entropy values, reduced random behaviour and increase in the complexity values can be associated to correlated structures immersed in the time series.
maximum and minimum values of complexity for a fixed value of the normalized entropy. Also, different marks are used to distinguish the numerical calculated values for controls and β-thalassaemia signals. The open symbols correspond to the values obtained using the corresponding grand average of Relative Wavelet Energy (see Fig. 4). b) Detail of the Entropy-Complexity plane.
From inspection of Figs. (5-7) it is clear that our introduced wavelet-based informational tools are able to distinguish between the two types of RBC under study. In particular, on Fig. (7), β-thalassaemia patients are almost equidistant between the curves of maximum and minimum complexity, while the control samples are closer to the curve of minimum complexity. On comparing the two groups of samples both have strong stochastic behaviour, however the control ones became almost ideal noise with H ≅ 1 and C ≅ 0, while disease samples appear more correlated and consequently, entropy decreases and complexity increases.
Beta thalassaemia minor is a silent disease, usually incorrectly prescribed with iron. This fact could explain the difference observed in the Information Theory quantifiers in relation with the controls, even when they do not differ excessively. In fact, little information exists to explain the erythrocytes viscoelastic properties. The present results suggest that the percentage of discocytes and also acontocytes, leptocytes and target cells, which are present in a sample are reflected in the corresponding photometrically recorded series of β-thalassaemia patients affecting the corresponding stochastic dynamics with an increase of the degree of correlation on them.
In summary the representation plane of complexity vs entropy could be a useful tool when dealing with biological data, which always have a stochastic component due to omnipresent dynamical noise, and could be used to classify different degrees of random behaviour. Moreover, this representation plane is an effective tool for revealing the sometimes hidden difference between chaos and noise as was recently shown [9]. The entropy-complexity plane yields additional information about the dynamics of the erythrocytes deformability. The use of the proposed entropy-complexity plane, based on data wavelet transform, can contribute to the analysis of erythrocytes membrane viscoelastic properties, and may also lead to a better understanding of their dynamics. Certainly the use of this plane is not intended to replace conventional analysis; instead, it aims to providing further insights into the underlying dynamics.
ACKNOWLEDGEMENTS
This work was partial support from the Consejo Nacional de Investigaciones Científicas y Técnicnológicas (CONICET), Argentina. O. A. Rosso gratefully acknowledges support from CAPES, PVE fellowship, Brazil.