
RESEARCH ARTICLE
DoctorEye: A Clinically Driven Multifunctional Platform, for Accurate Processing of Tumors in Medical Images
Emmanouil Skounakis*, 1, 2, Christina Farmaki1, Vangelis Sakkalis1, Alexandros Roniotis1, 3, Konstantinos Banitsas2, Norbert Graf4, Konstantinos Marias1
Article Information
Identifiers and Pagination:
Year: 2010Volume: 4
First Page: 105
Last Page: 115
Publisher Id: TOMINFOJ-4-105
DOI: 10.2174/1874431101004010105
Article History:
Received Date: 8/12/2009Revision Received Date: 1/3/2010
Acceptance Date: 4/3/2010
Electronic publication date: 27/7/2010
Collection year: 2010
open-access license: This is an open access article licensed under the terms of the Creative Commons Attribution Non-Commercial License (http://creativecommons.org/licenses/by-nc/3.0/) which permits unrestricted, non-commercial use, distribution and reproduction in any medium, provided the work is properly cited.
Abstract
This paper presents a novel, open access interactive platform for 3D medical image analysis, simulation and visualization, focusing in oncology images. The platform was developed through constant interaction and feedback from expert clinicians integrating a thorough analysis of their requirements while having an ultimate goal of assisting in accurately delineating tumors. It allows clinicians not only to work with a large number of 3D tomographic datasets but also to efficiently annotate multiple regions of interest in the same session. Manual and semi-automatic segmentation techniques combined with integrated correction tools assist in the quick and refined delineation of tumors while different users can add different components related to oncology such as tumor growth and simulation algorithms for improving therapy planning. The platform has been tested by different users and over large number of heterogeneous tomographic datasets to ensure stability, usability, extensibility and robustness with promising results.
Availability
The platform, a manual and tutorial videos are available at: http://biomodeling.ics.forth.gr.
It is free to use under the GNU General Public License.
1. INTRODUCTION
Cancer is a leading cause of fatality among other diseases. Still, there is no known way of preventing cancer, but early detection allows treatment before cancer is metastasized to other parts of the body.
Tomographic images are crucial for early diagnosis of cancer and therefore tools and services that facilitate the analysis and interpretation of such medical images can significantly add value to robust diagnosis and optimal therapy design. Modern tomographic systems like the new Magnetic Resonance Imaging (MRI) scanners, offer clinicians high resolution images allowing a more specific look at radiologic anatomy. They offer the ability to detect masses and distortions of tissue better, quicker and more efficiently than ever before. This makes MRI imaging a very popular technique in cancer imaging, allowing doctors to extract critical pathophysiological information in order to establish early diagnosis and assess the stage of the disease. However, it is often the case that a radiological department and specifically oncologists deal with a large number of MRI multi-frame slides where tumor identification and delineation can be a thorny and time consuming process.
While numerous existing projects are developing specialized platforms and tools to speed up the process of data analysis in different biomedical applications, most of the open access solutions often require engineering skills to understand their complicated user interface, rendering their clinical use problematic. In addition their whole design is rarely taking into consideration the actual clinical user needs or the specific features that the clinician needs to derive qualitative and quantitative diagnostic information. Such existing image-annotation platforms include VANO [1], CMAS [2], Hybrid System [3], Annotor [4], Amiravis [5] and Itk-SNAP [6].
DoctorEye on the other hand is a novel, open access, more flexible and easy to use platform, for intuitive annotation and/or segmentation of tumor regions. Its development is clinically driven and follows an open modular architecture focusing on plug-in components. Clinicians who have used this over a large amount of datasets find the platform’s environment simple and user friendly, and claim that only some basic knowledge of annotation/simulation processes is required to use this system.
The main advantages of the proposed platform over existing ones include fast and accurate delineation of large datasets (even in areas with complicated shapes), the ability to set multiple labels that allow the user to annotate and manage many different areas of interest in each selected slide and more importantly the clinically driven modular design, and functionality ensuring that it has the potential to be used routinely in the clinical practice.
Another feature that adds value to the platform is that while it offers ‘standard’ functionalities for oncology image analysis, annotation/segmentation and 3D visualization, it allows the easy incorporation of more specific and sophisticated plug-ins that can empower the clinician to use modern technologies for enhanced diagnosis and therapy design. As an example, computational “in-silico” models of cancer growth and simulation of therapy response are easily plugged in, allowing modeling assisted therapy decision making.
Currently, our group has incorporated such models in the platform in a version that will also be freely available. In this context, the platform could also serve as a validation environment where the simulation predictions can be compared with the actual therapy outcome in order to achieve a global optimization of the modeling modules.
The development of this platform is a part of the “Contra Cancrum” EU-ICT research project and is currently used by the clinicians for oncology 3D annotation and visualization.
2. Materials and Methodology
2.1. Platform Design
The platform was developed from scratch based on the .NET framework architecture [7] and can be used in any Windows-based computer with the .NET framework ver. 2.0 or later. However, .NET framework permits, in concept, the porting of the application in many other Linux based environments, using the Mono project [8] functionality and libraries, so the user can run an application using the No-Touch Deployment [7].
The graphical interface is based on Microsoft Office 2007 applications to ensure a user-friendly environment. This new implementation interface gives the user the option to change the appearance of the interface by choosing one of the “skins” located between the “view” and the “tools” groups of buttons.
Its basic functionality is described below:
2.1.1. Slide Selection and Presentation Context
The user can select any number of medical images in DICOM format from a group of thumbnails to process. These thumbnails will appear in a resizable area at the bottom of the screen as shown in Fig. (1).
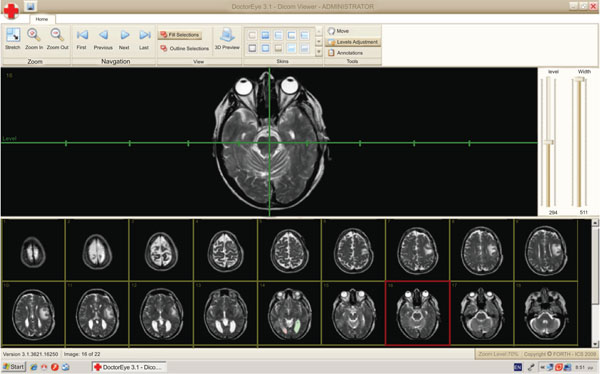 |
Fig. (1). DoctorEye: Snapshot of the main window. The user is able to easily navigate through the available slides and select the one to process. |
At this point, the user can also adjust the level and width values by using a system of axes. Two options are also available here. The first allows the user to zoom in or out and the second to shift the position of the selected image on the screen in order to have a better view of the regions of interest.
2.1.2. Annotation Tools and Segmentation Algorithms
The user can activate the “Annotations” panel to delineate either areas or contours of potential tumors in the selected medical image. These areas can be annotated, categorized, deleted, added and redefined as depicted in Fig. (2).
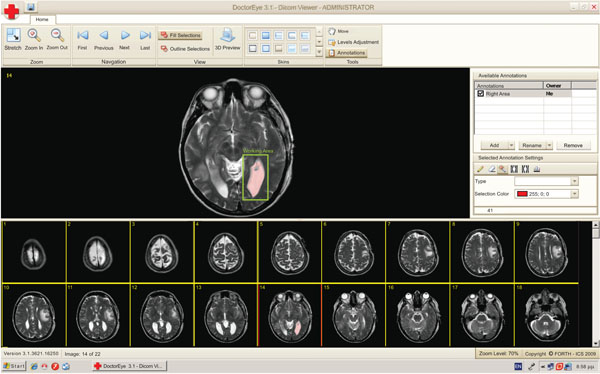 |
Fig. (2). A single slide is selected for further processing. A working area has been set (green rectangle) and the segmentation algorithm has been applied. The selected area is labeled in pink. |
To start the processing, the user must first press the “add” button in the annotations panel to create a new label. This label can be added to a single slide or to a group of slides automatically by choosing those from a window with the thumbnailed medical images.
The segmentation process starts with the first image of the selected group of images and at this point the user has to choose a segmentation algorithm. The user can then define a “working area” where the segmentation method will be applied (Fig. 2). At the end of this process the above mentioned label will correspond to the area which will be identified by the algorithm. The user may also specify the color of the selected region (red being the default color) in order to define two or more areas in the same region of the image.
Two segmentation methods are currently available in the platform as discussed in section II-B.
Finally, contour refinement is possible by using the “eraser” and “pencil” tools, where any mistakenly selected or ignored pixel can be removed or added, respectively, in order to end up with the best possible delineation of the identified tumor.
The label that had been given at the beginning of the process is now available in the “annotations” panel corresponding to this specified tumor. It can be selected and the specified tumor will be displayed.
The platform also gives the ability to select and delineate multiple tumors (i.e. in the case of metastasis) with different labels and colors, either in the same or any other slide as shown in Fig. (3).
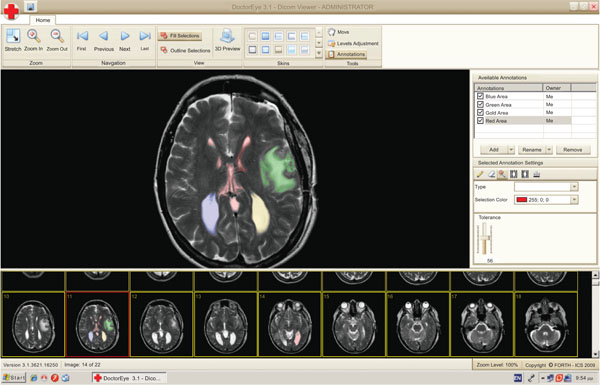 |
Fig. (3). Different areas of interest may be annotated accordingly using respective labels in different colors. This can be done in the same slide in the case of metastasis. (Blue and Gold depict areas which are easy to segment while Red and Green depict more complex areas). |
2.1.3. Annotation Storage
The “save” option in the main menu saves the selected areas in the corresponding medical images the user has been working on. The stored information is displayed automatically and can be accessed when pressing “open” a new image or a sequence of images.
The “Save as’ option in the main menu provides the following options to save your selections (annotations) alternatively as:
- “Annotation” (store the selected areas of your annotations in a .txt file)
- “Annotation’s Outline” (store the contour of your annotations in a .txt file)
- “Xml file” (presents the area of your annotations in a .xml file)
- The 3rd party application” option produces 3 files:
- The “Size.dat” which includes the size (number of rows x number of columns) of the MRI Images and the total number of the slices contained in the specific MRI dataset (ex. 512,512,22 means that the dimension of the images are 512 rows x 512 columns x 22 slices).
- The “TumorPoints.dat” which contains data in the form of “x,y,z,concentration”. Here x,y are the coordinates for a specific point in the tumor in a slice while z indicates the number of the slice where this point is located. The concentration value is currently set to 200 until a new method of getting the correct concentration value is developed.
- The “Volume.dat” which includes all the points of the tumor, starting from the first point in the first slice and finishing in the last point in the last slice in a sequence (as a volume), showing the gray-level value of every point (takes values from 0 to 255)
2.2. Segmentation Methods Applied
Medical image segmentation has been a subject of vast research in the past years. Both the automatic and semiautomatic detection and delineation of tumors (glioma in this test case), typically involve different types of tissue and fuzzy boundaries rendering them difficult to segment. At this phase of the development, we focus mostly on MRI imaging modality since MRI has been mostly used by the clinicians in the glioma case.
Two different, in terms of underlying theoretical concepts, segmentation algorithms are currently available in the platform: namely the “Magic Wand” and Spatially Adaptive Active Contours, while any other algorithm can be easily plugged-in as well. The first is based on image intensity, whereas the “active contours” are model-based methods.
2.2.1. The Magic Wand Algorithm
The function of the Magic Wand Algorithm is based on finding and selecting all the pixels around a pre-specified user-selected initial point that are similar in gray intensity. A tolerance value can also be set by the user to determine how closely to match colors (higher tolerance ends up in a larger selection) [9].
All the points selected by the algorithm are automatically stored in an image mask of the same size as the original image. Each pixel in the image mask represents the position of the selected pixels in the original image and is used to label the delineated tumors.
To enhance its effectiveness, we have implemented a faster version of this algorithm which excludes all the pixels that have already been examined ensuring that the algorithm does not check them again.
Apart from being able to work with the original image(s), another integrated option allows the user to work with the image displayed on the screen after the level and the width values have been adjusted by the user, in order to facilitate the image processing task.
2.2.2. Spatially Adaptive Active Contours
The Spatially Adaptive Active Contour technique developed by our group [10], is an extension on the traditional active contours, or snakes, which have been widely used in image processing for segmenting image entities and delineate object boundaries. The snake algorithm, first introduced by Kass et al. [11], is a semi-automatic method, based on the deformation of an initial contour towards the boundary of the desired object, which is accomplished by trying to minimize an energy functional, designed so that its minimum is obtained at the desired boundary. The snake evolution can be driven by adjusting four constant and global parameters, which control the curve’s smoothness and continuity, and the force that pushes the snake to expand.
In the platform described in this paper we integrated an improved version of the traditional active contours, which we call the Spatially Adaptive Active Contours1. This algorithm is based on the discrimination of image regions according to underlying characteristics, such as gradient magnitude and corner strength, and the assignation to each region with a different “localized” set of parameters, one corresponding to a very flexible snake, and the other corresponding to a very rigid one, according to the local image features. Therefore, the snake exhibits different behavior within image regions with diverse characteristics, thus, providing more accurate boundary delineation.
This segmentation technique is semi-automatic, which means that the user only needs to place an initial contour inside the desired object (tumor area or organ) and let it evolve towards its boundaries. It has been extensively tested on real data of nephroblastoma cases and seems to follow very satisfyingly the clinical expert’s intuition, concerning the true tumor boundaries. A theoretical background on the traditional snakes follows, as well as the details of the approach used.
2.2.3. Traditional Active Contours: Snake Energy Formulation
A traditional snake is a curve that evolves in time, in order to adapt to nearby edges, through the minimization of a suitably formulated energy function. In continuous space, a snake is represented as:
 |
(1) |
where S ∈ [0, 1] is the normalized length around the snake. In practice, a snake is a set of x and y coordinates of its N points and the parameter S ∈ [0, N] is the actual index of the contour points.
The total energy functional of the traditional snake, which will be minimized, has the following form:
 |
(2) |
where Einternal, Eimage and Einternal denote the internal energy of the curve, the image energy and the energy produced by external constraints, respectively.
The internal contour energy is defined as:
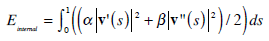 |
(3) |
where  and
and  denote the first and second derivative of v (s) with respect to s. The parameters α and β are weighting parameters that control snake’s elasticity and curvature, respectively: low values of α allow the snake points to be unevenly distributed along the contour, whereas higher values force the snake to retain evenly spaced contour points. Correspondingly, low values of β allow the snake to become second-order discontinuous and develop corners along its perimeter, whereas high values predispose the snake to smooth contours.
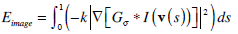
The image energy term, Eimage depends on the gradient of the image and is associated with the forces that pull the snake towards the desired image boundaries. Given a gray-level image I(x,y), it is formed as:
 |
(4) |
where Gσ is generally a pre-processing image filter that is convolved with image I in order to improve image characteristics, and ∇ denotes the gradient operator. The parameter k controls the extent of the influence of that term to the total energy.
The balloon energy Gbaloon is produced by a pressure force that pushes the snake to specific direction, either to expand, or shrink. This force is defined as:
 |
(5) |
where  is the unit vector, normal to the curve, at point v(s), and f is the amplitude of this force. The balloon force is used in order to overcome non-important edges that would cause the snake to stop in local minima.
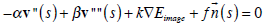
According to variational calculus [12], a snake that minimizes its total energy Esmoke, as defined in (2), must satisfy the Euler equation:
 |
(6) |
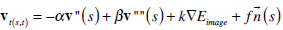
In order to solve the above equation, we treat v as a function of both time t and space s and by introducing a gradient descent scheme for the partial derivative of v with respect to t, we obtain the resulting equation:
 |
(7) |
At equilibrium vt = 0 and we reach a solution of (6). Equation (7) can be solved iteratively by using the finite difference method for the discretization of the function derivatives, as described in [11].
In discrete space, the snake is actually a set of x and y coordinates of its N points and the parameter s ∈ [1, N]is the actual index of the contour points. The number of the snake points, N, depends directly on the resolution selected for the snake contour, that is the distance between two consecutive snake points. Normally, a distance of two pixels is quite satisfying (this resolution used in this implementation). However, since the snake is constantly expanding, if the number of snake points was kept constant, then the distance between them would grow larger during each iteration. In order to keep the resolution steady, we re-parameterise the snake every five iterations and add new points so that the distance between them is always the same. This way, the number of snake points is growing larger, while its resolution remains constant.
As was explained in the previous section, the snake’s behavior during its evolution is controlled by four parameters.
By adjusting those parameters, traditional snakes can yield satisfying results in cases where the boundary of the desired object is quite distinct and its inner region homogeneous.
However, in medical images, the regions of interest are often inhomogeneous and include several small areas with different intensity levels than the original organ or tumor, thus segmentation becomes a difficult task.
In such cases, if the snake parameters are adjusted so that extreme curve bending is allowed, the snake will be ‘caught’ up in local edge maxima, produced by small internal high-contrast regions that lie far away from the correct border.
On the contrary, if the parameters are adjusted so that we obtain a very rigid snake, local inhomogeneities of the outline would not be detected, leading to poor boundary definition.
In order to overcome these difficulties, we integrated on the platform the spatially adaptive active contours, which are based on dividing the image pixels into two different groups and assigning a different parameter set to each one, thus allowing the snake to topologically adapt its behavior according to the characteristics of each pixel region.
For the efficient determination of those image regions, a binary mask is produced, where the white pixels correspond to the regions where we wish the snake to be flexible, and the black pixels indicate the regions where we want the snake to be rigid. The extraction of this binary mask is based on gradient and corner features.
The overall approach involves the following major steps, which are shown in Fig. (4):
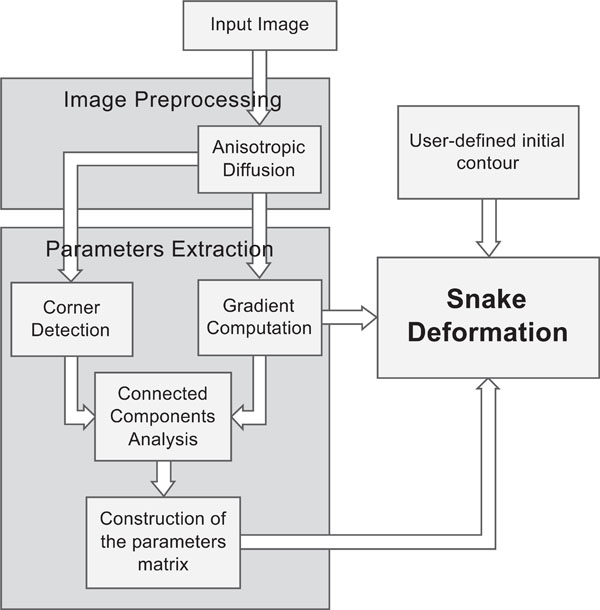 |
Fig. (4). A flowchart, illustrating the steps of the Spatially Adaptive Active Contours. |
- Anisotropic diffusion filtering: First, a pre-processing step of the input image is incorporated, using an edge-preserving anisotropic diffusion filter. This filter was first formulated by Perona and Malik [13] as a diffusion process that encourages intraregional smoothing, while inhibiting interregional smoothing. This way, the image appearance is simplified and small image artifacts are smoothed, while structures of interest, such as edges, are enhanced.
- Employment of gradient information. We obtain gradient information, by applying the Sobel operator [14] to the image. Fig. (5b) shows the resulting image representing the strength of the existing edges on the original image. Considering that strong edges are more dominant along the boundary of the object to be segmented, compared to the region that this boundary encompasses, a threshold is imposed on the gradient image, in order for the boundary to be coarsely detected and discriminated from the internal region. Therefore, an initial binary mask is constructed (Fig. 5c) where white pixels correspond to sharp edges, whereas black ones correspond to homogeneous regions.
- Employment of corner information. In this step, the Harris corner detector [15] is used to detect high curvature points in the image (Fig. 5d). Morphological dilation is performed on the output of Harris detector (Fig. 5e), thus small circular areas are obtained, which represent the neighboring regions around the detected corners. The resulting binary mask is shown in Fig. (5f).
- Construction of the final mask. In order to combine those two masks produced so far, a logical OR operator is applied on them, as shown in Fig. (6). Then, the 8-connected components of the binary mask are extracted, and the components with small area are discarded and a final dilation of the resulting mask leads to the final mask, shown in the bottom image of Fig. (6).
- Extraction of the parameters matrices. Pixels of the white region will be assigned with low α and β, and high k (which results in a very flexible snake), as well as very low f (which lets the snake be attracted by the boundary rather than be pushed to it). The pixels of the black region will be assigned with high α and β compared to k, and a very high value for the force f. This will push the snake to evolve towards the object boundary and when approaching it, it will slow down and fit correctly to the border details.
- Iterative snake deformation. The snake deformation takes place, as in the case of traditional snakes, but instead of using constant parameter values, each point of the snake has its own value, which can be attained by a look-up table process. This way, the user only needs to define the initial contour, by dragging an ellipse inside the desired object, whereas no parameter adjustment is necessary, since the parameters are predefined by the algorithm. Thus, minimum user interaction is accomplished. The stopping criterion for the iterative procedure in this implementation is the length of the contour: if the snake has the same length (that is, the same number of points) for more than 10 iterations, it is assumed that a steady solution has been reached and the procedure ends.
Fig. (7) shows an example of the application of both traditional active contours and the spatially adaptive active contour on an MR brain image.
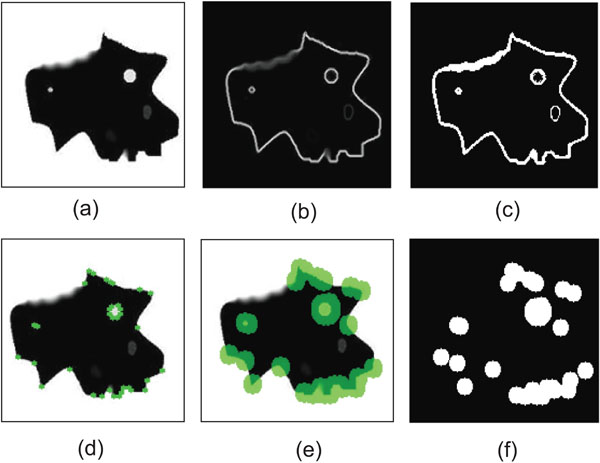 |
Fig. (5). Extraction of the initial binary masks, using gradient and corner information: (a) Original image, (b) Gradient image using the Sobel operator, (c) Thresholded gradient image, resulting into a binary mask, (d) Detected corners using Harris corner detector, represented as green points, (e) Dilated corner neighboring regions, represented as green disks, (f) The binary corner regions. |
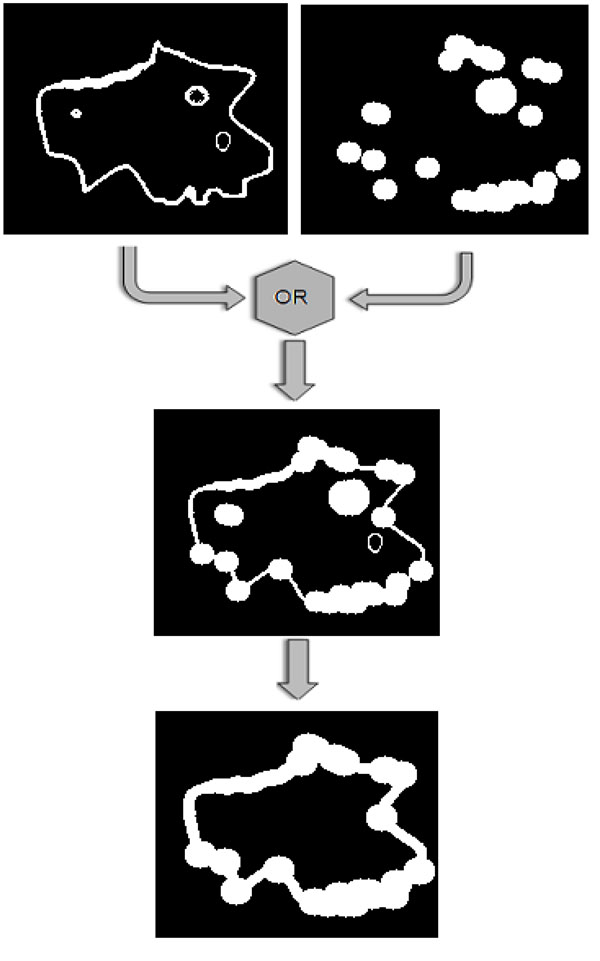 |
Fig. (6). The two binary masks that have been constructed using gradient and corner information, are combined by applying a logical OR operator and then the small connected components are discarded. |
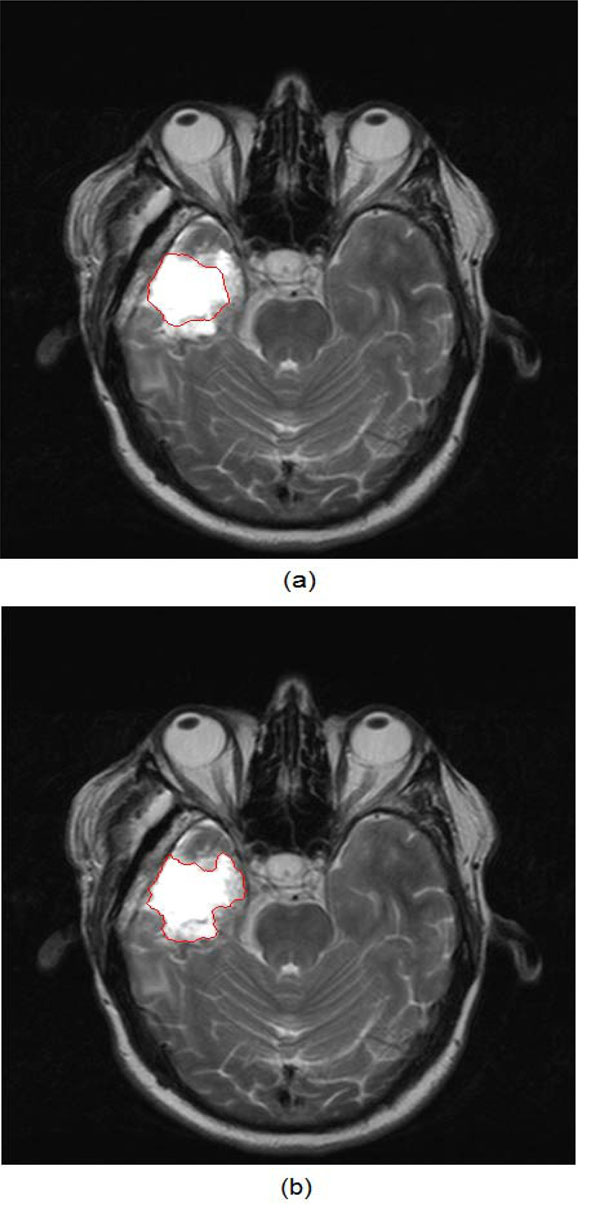 |
Fig. (7). (a) Result of the traditional active contours on an MR brain image, (b) Result of the application of the application of the spatially adaptive active contours on the same image. |
It is obvious that the improved version of the snakes can reach the true tumor boundary and at the same time, attain its detailed outline, while the traditional snake is caught up on the interior high-contrast inhomogeneities of the tumor.
2.3. Refinement Tools and Techniques
If images are extremely complex, the segmentation results may require further refinement by the expert, especially if the result is critical for other application (e.g. cancer growth simulation). The integrated tools and techniques can assist the user to achieve refined delineations of the tumors. These tools are the pencil, the eraser and the histogram. The latter allows the user to interactively define the histogram in known tissue types and use this information for manually refining the tumor delineation result. The Histogram tool gives access to the values of the selected tumor. By interactively defining the upper and the lower limit of these values, the user can reject some values located in the areas around those limits, thus achieving a more precise selection of the tumor.
Additionally, a “Multi-User authorization and management system” has been implemented where the “Administrator” can manage not only his work but also the work (ex. Annotations) of all the other users (Fig. 8). In contrast, a simple user (pending authorization) has only viewing rights to other people’s work.
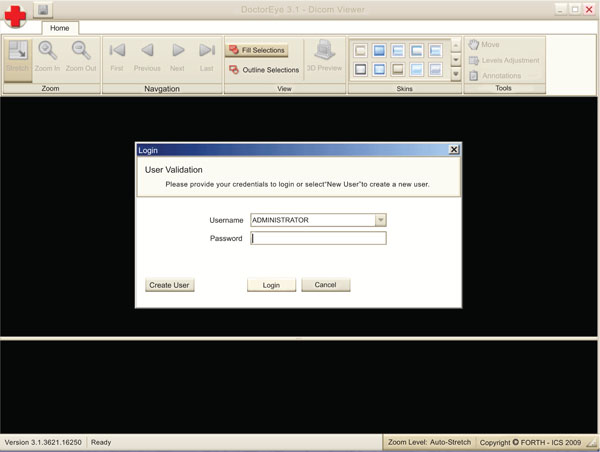 |
Fig. (8). A multifunction management system is implemented. |
This way, a number of different users can collaborate on delineating the same tumor. The administrator (Doctor) can choose the best delineated tumor in every single slice presented by the users, and has the option to rename it (ex. Left Tumor final) in order to achieve the best 3D representation of the tumor.
In addition, the “Manage User Accounts” window provides the Administrator with the following options: (use bullets, not numbers)
- To disable the access of a specific user
- To allow other users to become Administrators as well.
- To reset the password of a user (create a new one)
2.4. The 3D Representation Procedure
The annotations saved into the images include info such as who made the annotations, timestamp, the name of every annotation, the type as well as the points and color of every tumor.
All the above mentioned info was added not only to support a better 3D visualization of the tumor (depicts more than one tumors), but also to support potential future functions such as comparing the results given by two or more segmentation methods, etc.
For the 3D visualization of the segmented areas, we have used the Visualization Toolkit (VTK) which is a class library for 3D graphics and visualization. The 3D visualization process is presented by an interactive and resizable window that provides the user with a choice of environment parameters for the best representation of the findings (Fig. 9).
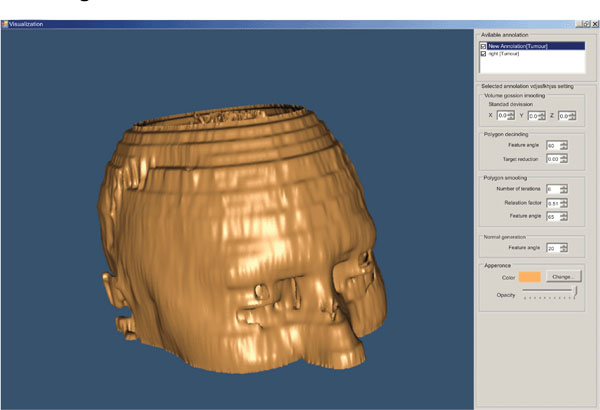 |
Fig. (9). 3D representation of a head (derived from 22 slices). |
The user can change parameters concerning the viewing angle of the findings, the color of the annotated areas, the transparency level of each of them, etc (Fig. 10).
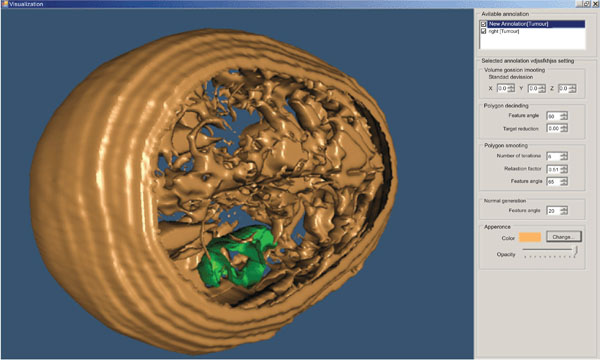 |
Fig. (10). 3D representation of a head – different angle (derived from 22 slices). |
The above illustrated example is the result of the segmentation of 22 brain images using the “BRAINIX - 401 MRI dataset” [16].
2.5. Processing Time
The time that is required for the user to reach the final 3D representation of the head and the pinpointed tumor (Fig. 6) using the “Magic Wand” algorithm on the “BRAINIX – 401 MRI dataset” [16] is shown below:
- For the introduction of the 22 images in the platform: 6 seconds.
- For the implementation of the algorithm to the head and the tumor: 4 minutes and 20 seconds.
- For the application of the 3D representation algorithm: 2 seconds.
For the above mentioned procedure, we used a laptop with OS “Windows XP Professional” having an Intel® Core™2 Duo processor at 1,73Ghz, and 3 GB memory.
2.6. Tumor Growth Modeling Plugin
The extensibility of the tool has been envisaged throughout its development, in the sense that it can include external plugins. One such plug-in has been developed by the Biomedical Informatics Laboratory of ICS-FORTH. This plug-in uses diffusive models in order to simulate the procedure of glioma growth in space and in time [17].
Firstly, the clinician has to define the boundary areas of the brain, i.e. the areas where tumor cells cannot migrate, such as bone or outer skull area. This can be done by using the annotation tools that have been described earlier. In the same way, the clinician has to delineate the tumor boundary areas.
Then, using the plug-in panel of Fig. (11), the clinician sets the modeling parameters, which are discussed in [17].
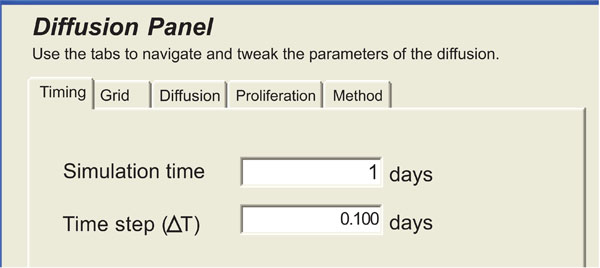 |
Fig. (11). Panel of the diffusive modeling plug-in. |
After running the simulator, the modeling results can be either visualized as slices or by presenting the volume reconstructed in 3D, as in Fig. (10). An example of modeling tumor growth with the plug-in applied on an MRI image set is given in Fig. (12). Four selected images out of 19 MRI slices are presented here. The heat-colored area denotes the simulated tumor cell concentration after 100 days of diffusion. This module can assist the clinician to improve optimal therapy design.
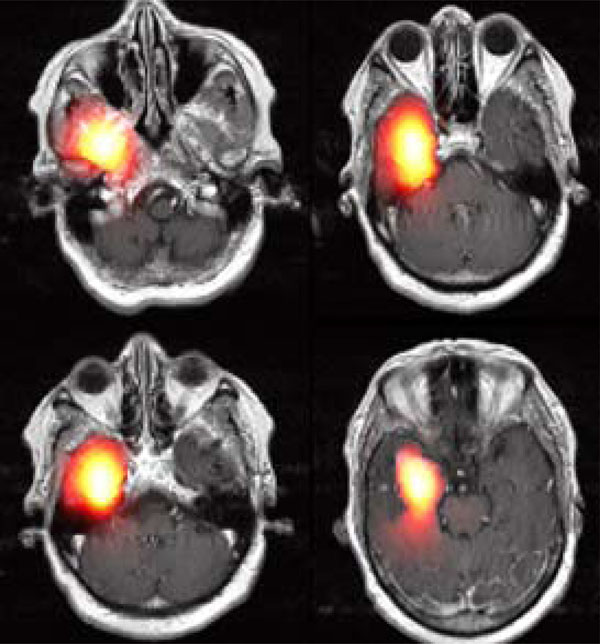 |
Fig. (12). An example of Modeling Results. The hot red area shows the simulated density of tumor cells in space after 100 days of diffusion. |
3. RESULTS
There are four basic features that characterize the platform. It is flexible, easy to use, fast to operate and since no registration or activation is needed it is freely distributed for testing.
The application interface is flexible and can be easily adjusted to suit different viewing setups by adjusting the width and height of the thumbnail and the main window by sliding the window separator bar. Therefore, the user can actively alter the number of the thumbnails that appear on the screen as well as the size of the selected image. The resolution and size of the screen are also taken into account for ensuring an optimal representation.
It is easy to use, as the platform is designed as a GUI environment with standard menus and buttons. Moreover, it enables the user to view the effects of the functions that are being implemented in the selected medical image while the user is experimenting with various parameters. It is fast to operate due to the fact that the algorithms used are fully integrated in the platform and run “on the fly” and not as calls to external programs. Finally, it is distributed free to test and requires no registration or activation [18].
Although the platform is being developed to meet the needs of clinicians, it is crucial to design several validation experiments that will deal with the functionality/usability of the algorithms as well as with the effectiveness of the tools in annotating tumors/ROIs. The latter requires comparing the annotations of experts (used as gold standard) to the generated segmentations and reports the sensitivity/ specificity score (our group has reported such results in [10]). The initial assessment of the methods used indicates that the “Magic Wand” method exhibits greater ease of use and is more applicable to medical images when the gray level profile of the tumor is highly homogenous and there is enough contrast with the surrounding tissues. In any other case, the use of the “Active Contours” segmentation method is advisable. This method, however, is non intuitive, in the sense that the user may find it difficult to interpret the physical meaning of the related parameters and predict the best possible values to be selected and adjusted individually for every tumor case.
The platform has already been adopted for annotating a large number of tumors in the EC Contra Cancrum Project ICT-2007-223979. Also, the incorporated adaptive active contour algorithm developed by our group has shown promising results in closely following clinical annotations [10].
4. DISCUSSION
DoctorEye facilitates the 3D annotation, image analysis and visualization of important medical image entities, such as cancer, from either MRI datasets or any other tomographic modality. The platform currently focuses on aiding the clinician to annotate/segment tumors as fast and accurately as possible. The platform is mainly designed to offer robust tools and services within a carefully designed platform for aiding the clinician to assess the stage of the disease, delineate the tumor, visualize it in 3D and also empower the user with novel technologies such as tumor growth/therapy response simulations.
Our current work focuses on incorporating even more tumor-specific semi-automatic segmentation methods in order to improve its robustness and make annotation even faster for the clinician (comparing to fully-manual annotation). This, however, is a very difficult task since tumor segmentation is a subjective task heavily dependant on the experience of the clinician and the quality of the medical images used. Nevertheless, it is expected that a larger number of human raters is needed for a thorough validation [19].
As future work we plan the use of the platform as a wider medical e-health management system, able to store complete electronic patients’ records together with disease specific clinical data and findings. As such, it could be used for remote consulting, especially in cases where the diagnosis is difficult and requires a second opinion. The currently implemented multi-user environment of the platform already facilitates clinicians to share and combine their medical expertise e.g. in tumor delineation. In this scenario, the medical images with the original annotations can be shared with another clinician for re-evaluation, in order to improve accuracy.
5. CONCLUSIONS
In this paper, we presented a novel, free-to-use platform that can assist doctors to better interpret, visualize and annotate tumors in tomographic images. The platform is already being used in a related tumor modeling EC project (ContraCancrum) and offers several robust tools for fast annotation, 3D visualization and cancer growth simulation that can assist the clinician in better understanding the pathology and defining the treatment.
NOTES
1 The details of this work were submitted to the International Journal of Computer Assisted Radiology and Surgery, on 27 of November, 2009, under the name “Spatially Adaptive Contours: A semi-automatic tumor segmentation framework”, where Figs. (5-7) of the current paper come from.
ACKNOWLEDGEMENTS
The authors thank Ioannis Karatzanis for developing various parts of the platform and algorithms and Angelos Armen for developing the 3D visualization module of the platform.
The team would like to thank the Clear Canvas Company for allowing free access to their code during the implementation of the Dicom Images Handling process [20].
This work was supported in part by the EC ICT project ContraCancrum, Contract No: 223979 and the EC ICT project TUMOR No: 247754.
REFERENCES
| [1] | Peng H, Long F, Myers E. VANO: a volume-object image annotation systemzz Bioinformatics 2009; 25(5): 695-7. |
| [2] | Lin I, Chao H. CMAS: a rich media annotation system for medical imaging In: Proceedings of the Medical Imaging. vol. 6145 In: Proceedings of the Medical Imaging. PACS and Imaging Informatics. Proceedings of the SPIE; San Diego, CA, USA. 2006; pp. : 34-41. |
| [3] | Mechouche A, Morandi X, Golbreich C, Gibaud B. A hybrid system for the semantic annotation of sulco-gyral anatomy in MRI images. In Proceedings of the 11th International Conference in Medical Image Computing and Computer-Assisted Intervention – MICCAI; New York, NY, USA. 2008; pp. 807-14. |
| [4] | Annotor [Online]. Available: http://www.montefiore.ulg.ac.be/services/stochastic/biomod/doku.php?id=software |
| [5] | Amiravis [Online]. Available: http://www.amiravis.com |
| [6] | Itk-SNAP [Online]. Available: http://www.itksnap.org |
| [7] | Benefits of the Microsoft. ET Framework [Online]. Available: http://msdn.microsoft.com/en-us/kb/kb00829019.aspx |
| [8] | The Mono project [Online]. Available at: http://www.mono-project.com |
| [9] | Fujita H, Fejri M. New trends in software methodologies, tools and techniques: How to create the magic wand?. Proceedings of the Fifth SoMeT-06; IOS press 2006; p. 127. |
| [10] | Farmaki C, Marias K, Sakkalis V, Graf N. A spatially adaptive active contour method for improving semi-automatic medical image annotation. In: Proceedings of the World Congress on Medical Physics and Biomedical Engineering; 2009; pp. 1878-81. |
| [11] | Kass M, Witkin A, Terzopoulos D. Snakes: Active contour models Int J Comput Vis 1987; 1: 321-1. |
| [12] | Logan J, Ed. Applied mathematics. 2nd ed. New York: Wiley 1997.Ch. 3 |
| [13] | Perona P, Malik J. Scale-space and edge detection using anisotropic diffusion IEEE Trans Pattern Anal Mach Intell 1990; 12: 629-39. |
| [14] | Gonzalez R C, Woods R E. Digital Image Processing Prentice Hall 2002; 134-7. |
| [15] | Harris C, Stephens M. A combined corner and edge detector. In: Alvey Vision Conference; 1988; pp. 147-52. |
| [16] | DICOM sample image sets. [Online]. Available: http://pubimage.hcuge.ch:8080. |
| [17] | Roniotis A, Marias K, Sakkalis V, Tsibidis G, Zervakis M. A Complete Mathematical Study of a 3D Model of Heterogeneous and Anisotropic Glioma Evolution. IEEE EMBS Conference; Minneapolis, USA. 2009. |
| [18] | DoctorEye software [online]. Available: www.ics.forth.gr/bmi/bioimaging.html |
| [19] | Warfield K, Wells W. Simultaneous truth and performance level estimation, (STAPLE): an algorithm for the validation of image segmentation IEEE Trans Med Imaging 2004; 23: 903-21. |
| [20] | Clear Canvas [online]. Available at: http://www.clearcanvas.ca |