
RESEARCH ARTICLE
DISTq: An Iterative Analysis of Glucose Data for Low-Cost, Real-Time and Accurate Estimation of Insulin Sensitivity
Paul D. Docherty1, J. Geoffrey Chase*, 1 , Thomas Lotz1, Hann Hann1, Geoffrey M. Shaw2, Juliet E. Berkeley2, J.I. Mann3, Kirsten McAuley3
Article Information
Identifiers and Pagination:
Year: 2009Volume: 3
First Page: 65
Last Page: 76
Publisher Id: TOMINFOJ-3-65
DOI: 10.2174/1874431100903010065
Article History:
Received Date: 10/8/2009Revision Received Date: 11/9/2009
Acceptance Date: 12/10/2009
Electronic publication date: 2/12/2009
Collection year: 2009
open-access license: This is an open access article licensed under the terms of the Creative Commons Attribution Non-Commercial License(http://creativecommons.org/licenses/by-nc/3.0/) which permits unrestricted, non-commercial use, distribution and reproduction in any medium, provided the work is properly cited.
Abstract
Insulin sensitivity (SI) estimation has numerous uses in medical and clinical situations. However, highresolution tests that are useful for clinical diagnosis and monitoring are often too intensive, long and costly for regular use. Simpler tests that mitigate these issues are not accurate enough for many clinical diagnostic or monitoring scenarios. The gap between these tests presents an opportunity for new approaches.
The quick dynamic insulin sensitivity test (DISTq) utilises the model-based DIST test protocol and a series of population estimates to eliminate the need for insulin or C-peptide assays to enable a high resolution, low-intensity, real-time evaluation of SI. The method predicts patient specific insulin responses to the DIST test protocol with enough accuracy to yield a useful clinical insulin sensitivity metric for monitoring of diabetes therapy.
The DISTq method replicated the findings of the fully sampled DIST test without the use of insulin or C-peptide assays. Correlations of the resulting SI values was R=0.91. The method was also compared to the euglycaemic hyperinsulinaemic clamp (EIC) in an in-silico Monte-Carlo analysis and showed a good ability to re-evaluate SIEIC (R=0.89), compared to the fully sampled DIST (R=0.98)
Population-derived parameter estimates using a-posteriori population-based functions derived from DIST test data enables the simulation of insulin profiles that are sufficiently accurate to estimate SI to a relatively high precision. Thus, costly insulin and C-peptide assays are not necessary to obtain an accurate, but inexpensive, real-time estimate of insulin sensitivity. This estimate has enough resolution for SI prediction and monitoring of response to therapy. In borderline cases, re-evaluation of stored (frozen) blood samples for insulin and C-peptide would enable greater accuracy where necessary, enabling a hierarchy of tests in an economical fashion.
Introduction
Insulin resistance (IR) has been widely accepted as a risk factor for type 2 diabetes (T2DM) and cardiovascular disease. A long-term study has shown those who developed T2DM had an average initial IR 60% higher than those who remained healthy [1]. An early diagnosis of IR may prompt interventions with the potential to delay the onset of the disease and therefore reduce long-term complications and health costs. However, the high cost and/or low resolution of the available insulin sensitivity (SI, SI=1/IR) tests precludes widespread screening [2]. Thus many diagnoses are not made until later in the disease stage and limit the potential gains [3].
It is generally agreed that SI is a measure of the efficiency of insulin for the reduction of glucose in the blood. However, the many available tests measure this effect in different ways [4, 5]. It is therefore necessary for the researcher/clinician to decide which test is best for any given situation in terms of intensity, cost, accuracy and physiological relevance. This decision thus implicitly states that there exists a hierarchy of such tests, each with different clinical use, and associated level of accuracy or resolution.
The hyper-insulinaemic euglycaemic clamp (EIC) [6] is widely accepted as the gold standard for SI testing. However, it is not used as a screening tool due to its high cost and clinical intensity. Tests such as the oral glucose tolerance test (OGTT), intravenous glucose tolerance test (IVGTT), and insulin-modified IVGTT (IM-IVGTT) are of lesser intensity, but equally lower accuracy and repeatability [7, 8]. The homeostatic model assessment (HOMA) or 2hr-OGTT are sufficiently inexpensive in cost, clinical time and intensity that they are regularly used for screening purposes. However, screening is not necessarily effective, because these tests have relatively poor resolution in the region of clinical significance [7, 9, 10]. They are thus even less effective in measuring the impact or change resulting from intervention. Table 1 summarises the accuracy and time demands of these SI tests.
Overview of the Most Frequently Used Insulin Sensitivity Tests
| Accuracy | Time Demand (Hours) | Notes | References | |||
|---|---|---|---|---|---|---|
| Intra- Subject CV | Correlation to Gold Standard | Clinician | Participant | |||
| EIC | 4 to 10% | Gold standard | 10 | 4 | Results is not guaranteed with an inexperienced clinician | ADDIN EN.CITE ADDIN EN.CITE.DATA [5, 6, 11] |
| IVGTT | 21% | 0.44 to 0.89 | 3-5 | 3-5 | Result generally requires a complex computerised solver | ADDIN EN.CITE ADDIN EN.CITE.DATA [8, 12, 13] |
| OGTT | 7 to 15% | 0.6 to 0.8 | 3-4 | 3-4 | Rate of appearance of glucose in plasma is relatively unknown | ADDIN EN.CITE ADDIN EN.CITE.DATA [5, 14, 15] |
| 2hr-OGTT | 15 to 40% | 0.45 to 0.74 | 0.5 | 2.5 | Poor repeatability in terms of re-classification rate | ADDIN EN.CITE ADDIN EN.CITE.DATA [7, 14, 16] |
| HOMA | 10 to 40% | -0.6 to -0.9 | 0.25 | 0.25 | Low resolution in region of clinical significance | ADDIN EN.CITE ADDIN EN.CITE.DATA [5, 17, 18] |
Shown are the assessed accuracies in coefficient of variation (CV=SD/mean) and correlation to the gold standard EIC; and the time demand in hours for the clinician and the participant.
A real-time and clinically relevant SI metric could be of significant value in many diverse clinical situations including: glycaemic control and sepsis diagnosis in an intensive care setting [19], monitoring the impact of type 2 diabetes therapy [20], and monitoring the impact of drug therapy [21]. Clinical studies also investigated SI as a metabolic health marker [22, 23]. Finally, such a knowledge of SI could aid glycaemic regulation and the development of personalised treatment plans for newly diagnosed diabetic individuals.
The dynamic insulin sensitivity test (DIST) is a recently developed low-dose, short-protocol test similar to the IM-IVGTT [17, 24]. The subject’s response to a relatively low dose (5-20g) IV glucose bolus followed by a low dose (0.5-2U) IV insulin bolus is monitored with samples assayed for glucose, insulin and C-peptide. These concentrations are used to identify model-based parameters for SI, endogenous insulin secretion (Uen) and liver clearance (nL) by solving the physiological model shown in Fig. (1). The model is a compartmental pharmaco-kinetic (PK) and pharmaco-dynamic (PD) model representing the physiological pathways and interactions between insulin, C-peptide and glucose in the human body [25]. Prior modelling studies have shown the SI value from the model can be highly correlated to the insulin sensitivity metric (ISI) from the EIC (R=0.99) [17], and a clinical validation study is ongoing with initial correlations of R≈0.78. Note that the DIST differs from the IM-IVGTT by measuring every 5-10 minutes and using significantly lower insulin and glucose doses.
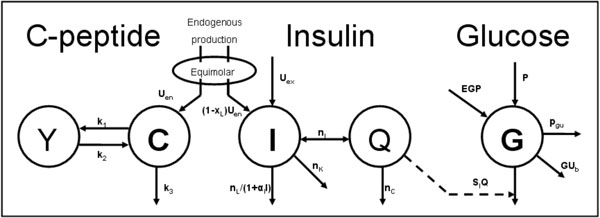 |
Fig. (1). The physiological compartmental model used to match the DIST test data (symbols are fully defined in the Methods section). |
This research presents and evaluates the quick DIST method (DISTq) which incorporates a novel method, assumptions and mathematical process to identify SI. The method only requires the glucose measurements from the previously presented DIST protocol [17, 24], and anatomical and demographic data available at the time of testing (height, weight, sex and age). Hence, relatively costly insulin and C-peptide samples that take 1-3 days to process in a separate lab are not needed and effectively real-time estimation is enabled. The method uses the DIST protocol and population-based parameter values to estimate the subject’s insulin concentrations during testing to replace these missing assays. This ability to estimate insulin concentrations in the subject is unique to the DISTq and in direct contrast to other surrogate SI tests that do not measure (or estimate) insulin and are therefore poorer predictors of SI and its changes due to an intervention.
Method
The DISTq solver method is based on model parameter and concentration estimates in an individual. These estimates are functions of the relationship between SI and various anatomical and/or physiological factors, and are used to approximate the subject’s insulin concentrations in the absence of direct insulin and C-peptide measurements. The DISTq is thus a subset of the fully sampled DIST [17, 24].
DIST Model
The DISTq method utilises the model developed in the pilot study of the fully sampled DIST test [17, 24]. The model is shown in Fig. (1) and is mathematically expressed:
C-Peptide Pharmaco-Kinetics
 |
(1) |
 |
(2) |
Insulin Pharmaco-Kinetics
 |
(3) |
 |
(4) |
Glucose-Insulin Pharmaco-Dynamics
 |
(5) |
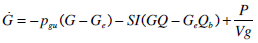
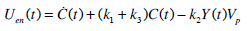
where: k1, k2, k3, nK, nL, and nC are rate parameters [min-1]; nIis the transport rate between plasma and interstitium [L·min-;min]; is the saturation coefficient of liver clearance [L·mU-;mU-1]; C and Y are plasma and interstitial compartment C-peptide concentrations [pmol·L-0B7;L-1]; Uen is the rate of endogenous insulin and (equimolar) C-peptide production [mU·min-7;min-1]; I and Q are plasma and interstitial compartment insulin concentrations [mU·L-7;L-1]; Uex and P are the insulin and glucose bolus inputs [mU and mmol]; Vp and Vq are volumes of distribution of plasma and interstitium, respectively [L]; xL is the fractional first pass liver extraction [mU·mU-7;mU-1]; G is the glucose concentration in plasma [mmol·L-0B7;L-1]; Ge and Qb are equilibrium or basal levels of the respective analytes [mmol·L-0B7;L-1]; Vg is the volume of distribution of glucose [L]; and pgu is the non-insulin mediated glucose disposal rate [min-1].
DIST Pilot Protocol
Sixteen subjects were recruited and underwent a total of 46 DIST tests in the DIST pilot study [24]. subjects reported to the place of testing in the morning, having fasted overnight. All tests were completed in a seated position with a cannula inserted into the antecubital fossa, through which glucose (50% dextrose) and insulin (actrapid) boluses were administered and blood samples taken. subjects had blood samples taken at 0, 10, 15, 20, 25, 30, 35, 40, 50, 60 minutes. The glucose and insulin injections immediately followed the 10 and 20 minute samples, respectively. Timing of samples and boluses were kept to the closest minute. Three dosing protocols were used in this pilot study:
- Low - 5g glucose, 0.5U insulin
- Medium – 10g glucose, 1U insulin
- High – 20g glucose, 2U insulin.
All samples were assayed for glucose (Enzymatic glucose hexokinase assay, Abbot Labs, Illinois USA), insulin and C-peptide (ELISA Immunoassay, Roche, Mannheim, Germany). Further details of the participant attributes, protocol and results can be found in [24].
Requirements for DISTq Profile Estimation
The DISTq method was developed to provide an accurate estimation of SI in clinical real-time, meaning a diagnostic outcome can be generated within 5 minutes of test completion. Insulin and C-peptide assays need to be performed in a laboratory and thus do not provide immediate results. However, precise estimation of SI is not possible without an accurate indication of insulin concentrations.
DISTq overcomes this lack of information by utilising population-based assumptions to estimate insulin concentrations in an individual. Fig. (2) shows a typical subject-specific simulated response to the DIST protocol. Shown are endogenous insulin secretion rate Uen(t), and plasma and interstitial insulin concentrations, I(t) and Q(t). The qualitative shape of the kinetics shown are relatively consistent between subjects. However, the magnitude of the kinetics varies with dosing and (diagnosed) diabetic or metabolic status.
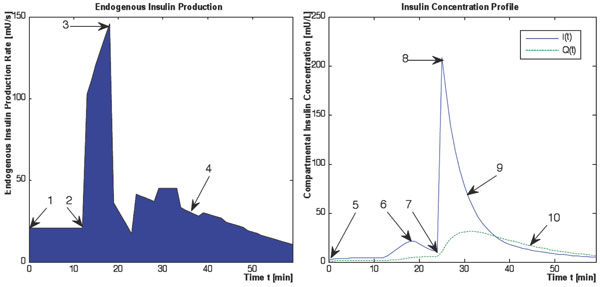 |
Fig. (2). A typical endogenous insulin production and resulting insulin concentration response to the DIST protocol. Shown are the endogenous insulin secretion rate profile Uen(t) (left), and the plasma and interstial insulin concentrations, I(t), Q(t), (right). The kinetic features required to describe the profiles in the absence of insulin and C-peptide data are shown by numbers 1-10. |
Comprehensive and unique endogenous insulin production and insulin concentration profiles can be simulated with knowledge of the 10 kinetic features shown in Fig. (2). Five of these 10 characteristics can be isolated by the protocol, or the physiological assumptions used in the full DIST test. These five characteristics are listed below with numbering in accordance to the corresponding features shown in Fig. (2) and an explanation of how they are determined:
- 1 The first phase Uen response (initial secretion peak) is assumed to begin immediately or within 1 minute of the glucose bolus with known timing [26].
- 6 The first phase Uen will be visibly manifested in I(t).
- 7 The administration time of the insulin bolus is recorded during the trial.
- 8 The concentration of insulin in plasma immediately following the insulin bolus is readily defined by the mass of the bolus divided by the plasma distribution volume (Vp).
- 10 The rate of insulin diffusion and transport between plasma and interstitial compartments has been defined by [27]. Thus, Q(t) can be defined solely as a function of transport rates, a steady state concentration ratio (γ), and the measured or calculated I(t) profile.
The five remaining kinetic features shown in Fig. (2) cannot be readily inferred by the structure of the protocol, the model used, or the specific measurements, and must be derived using other methods. These features are listed below with numbering in accordance to Fig. (2):
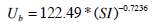
- 1 The basal Uen production rate (Ub)
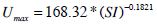
- 3 The maximal first phase response to the glucose bolus (Umax)
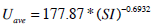
- 4 The degree to which the second phase response will be suppressed by elevated insulin concentrations after the exogenous insulin bolus (Uave)
- 5 The basal insulin concentration in plasma (Ib)
- 9 The rate of liver disposal of insulin from plasma (nL)
Mathematical or a-priori relationships between these parameters are not evident or reported elsewhere. However, relationships were apparent between these parameters and SI derived from the full test data. After the parameters of interest and SI were solved using data from the fully sampled DIST tests, the parameters were plotted against SI and trends became apparent. These trends can be seen in Fig. (3). The DISTq method utilises these trends to enable a-posteriori parameter estimation and unique simulations of endogenous and overall insulin kinetics responses to the test protocol.
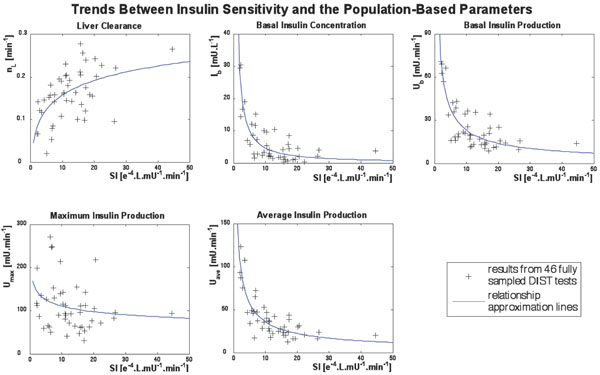 |
Fig. (3). Trends between insulin sensitivity and the five population-based parameters that cannot be defined with a-priori identification methods. The blue lines are representative of the approximation equations that are used to identify the parameters (Equations 14-18). |
Full DIST Test Data Analysis
The results from the fully sampled DIST tests are used to develop the population equations characterising the trends in insulin kinetic parameters. Equations (1) to (5) are the pharmacokinetic, multi-compartmental equations used to derive the model parameters from the DIST data [17, 24].
Equations (1) and (2) can be solved directly to find Uen(t) using a linear interpolation (evaluated at 1 minute intervals) of the C-peptide data C(t), and a Picard iteration to find Y(t). A Picard iteration is capable of solving non-linear systems using discretised transforms of the governing ODEs [28, 29]. In this case, the iteration uses updating predictions of the Y(t) profile to converge to a highly accurate Y(t).
 |
(6) |
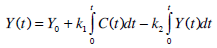 |
(7) |
Therefore, Uen(t) can be obtained directly using Equation (7) for Y(t) and C-peptide assay data, as defined:
 |
(8) |
where  is evaluated plasma C-peptide concentration change at one minute intervals using the interpolated minute-wise C(t) profile.
The insulin data can be used to obtain a value for the liver clearance parameter (nL). To identify nL, an integral formulation of Equations (3) and (4) similar to [30] is used. The first step is to define Q(t). The iterative integral method is sufficiently robust that interpolated initial guesses allow later iterations to produce highly accurate re-simulations of insulin concentration. Thus, the initial I(t) estimate is simply a linear interpolation of the measured insulin data and the initial Q(t) is equal to half I(t) as defined by the steady state ratio of insulin concentration between the plasma and interstitium (γ):
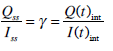 |
(9) |
Integrating Equation (3) from 0 to t for the given estimate Qint(t) of Equation (9), and assuming I(t) is a linear interpolation of the measured data yields:
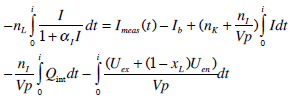 |
(10) |
where: Ib= Imeas(0) and I=Iint(t).
Choosing N time points in Equation (10), corresponding to the number of data points, gives N equations with one unknown, nL. These equations can be readily solved by linear least squares to give an initial estimate for the value of nL. For this given value of nL, Equations (3) and (4) are then numerically solved using a Picard iteration [28, 29] to determine a new I(t) and Q(t) (Inew(t) and Qnew(t)). Depending on the accuracy of the first estimate, I(t) and Q(t) may not yet give an optimal match to the data. The reason for this error is that the initial linear interpolation to the measured I(t) may not capture the true peaks, introducing error into the integral terms of Equation (10). A solution to this problem is to replace Iint(t) and Qint(t) in Equation (10) with Inew(t) and Qnew(t), then determine a new nL by a similar linear least square approach. This process can be continued until convergence is reached. In contrast to the methods presented for the fully sampled DIST test pilot study [24] the first pass extraction parameter xL is fixed at a population average value of 0.7 [31-33].
A similar method is applied to the glucose model, Equation (5), with two variable parameters to be identified, SI and Vg. Integrating Equation (5) from 0 to t yields:
 |
(11) |
Choosing N values of time t= t1,…,tN in Equation (11) gives a matrix system defined:
 |
(12) |
where
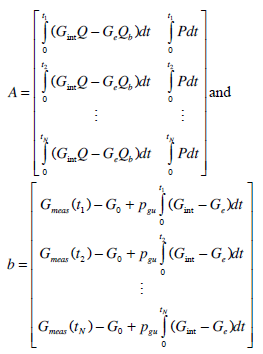 |
(13) |
Solving Equation (12) by linear least squares provides an initial estimate to SI and Vg, as was done with nL in Equation (10). Gint(t) is re-simulated using the estimated values for SI and Vg and substituted into the integrals of Equation (12) to determine a new matrix A and vector b in Equation (13). Equation (12) is solved again by linear least squares and this process is continued until convergence.
The DISTq process utilises parameter estimations to predict the insulin concentration profile of a subject during a DIST test. Using the methods described above, the parameters required for this process have been defined for the full DIST data set. The goal is to estimate these parameters based on population relationships between their values resulting from the DIST as defined above. The paramters to be identified are:
- Ub: the first value of Uen(t) - (deconvolution of Equation (8))
- Umax: the maximum value of Uen(t) - (deconvolution of Equation (8))
- Uave: the average value of Uen(t) - (deconvolution of Equation (8))
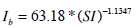
- Ib: the basal insulin measurement - (direct measurement)
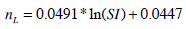
- nL: the liver clearance rate - (identification of Equation (10))
- SI: insulin sensitivity - (identification of Equation (12))
Population Based Parameter Estimation
The population-based parameters (Ub, Umax, Uave, Iband nL) are compared to SI from the full DIST [17, 24] and anatomical parameters (height, weight, BMI, BSA) obtained from the individuals. The population based parameters show a stronger relationship to SI in Fig. (3) than to any a-priori patient-specific information that would be available at the time of testing. In particular, Ub, Uave and Ib all have a power relationship with SI. Umax does not have a strong relationship to SI, but is also estimated with a power relationship. In contrast, nL is predicted using a log relationship to SI. Equations (14) to (18) define the mathematical relationships between the parameters (shown as the blue lines in Fig. 3). Note that no dispensation has been made to adjust any parameters for different dosing, which adds to some of the spread seen in Fig. (3), and thus providing a conservative trend.
 |
(14) |
 |
(15) |
 |
(16) |
 |
(17) |
 |
(18) |
DISTq Method
DISTq is an iterative method that uses an initial population average SI value (SI= 10-4L .min -1mU-1) in Equations (14) to (18) to provide an initial estimate for the unknown parameters needed to generate an interstitial insulin profile Q(t). This Q(t) profile can then be used with just the glucose data and Equation (12) to generate a new more accurate prediction of SI. This new SI is then used in Equations (14) to (18) to redefine the unknown parameters: Ub, Umax, Uave, Ib and nL. In turn, these redefined parameter values are used to re-simulate a new Q(t) profile. Equation (12) can then be solved again with the glucose data for a new, updated prediction of SI. This process is iterated up to five times or until SI stabilises to within 0.01% change between iterations. Fig. (4) shows this process schematically, denoted as the first iterative loop in the process.
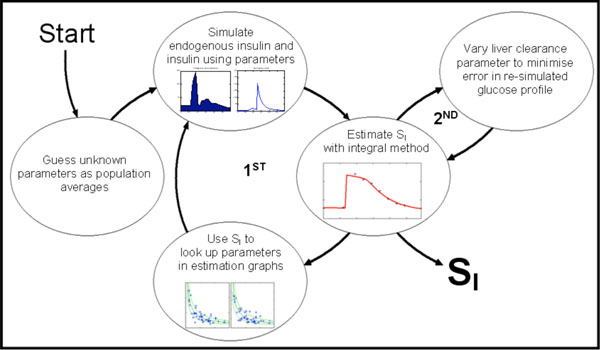 |
Fig. (4). A schematic of the DISTq iterative solver cycles (Including optional second cycle to optimise liver clearance rate). The first cycle is iterated five times to identify SI. The second cycle can be used to further refine the resultant SI by varying the nL parameter. |
A second, subsequent iterative cycle can be used to further increase the accuracy of the derived SI. If the glucose data following the insulin bolus is of sufficient resolution, an inference can be made into the shape of the insulin decay curve. Once the initial iterative process has converged to a value for SI, the value of nL is allowed to vary up to ±20% and SI is then further refined. The nL value that minimises the least-square error in the re-simulated glucose concentrations is used to define the new (second iteration) value for SI. This second cycle is also shown in Fig. (4).
2.7. Analyses
2.7.1. Part One: Clinical Equivalence of the DIST and DISTq Solver Methods
It is important to determine whether accurate SI estimation is possible when insulin and C-peptide data are not used. To assess this, SIDISTq is compared to the fully sampled SIDIST using a Pearson correlation coefficient. Results for both the basic DISTq method (1st iteration) and the additional nL variation (2nd iteration) are compared to the full DIST test value.
Furthermore, the DISTq method’s dependence on their initial SI estimations is evaluated by comparing estimated SIDISTq values obtained using initial SI estimations from differing ends of the expected range (2 to 30 L·mU-1·min-1). If the DISTq method is independent of the initial SI estimate, the resulting SIDISTq values for any trial data should be identical.
2.7.2. Part Two: Separating the Derivation Set from the Validation Set
If the DISTq is to be used exclusively in a clinical study, the population characteristics will not necessarily be known. To address this issue, the validation data set is isolated from the derivation data set. In particular, the parameter relationships of Equations (14) to (18) are generated from the results of 37 (of 46) randomly-selected full DIST trials. The remaining 9 trials are used as an independent validation set to compare the DISTq result to the fully sampled DIST results. This random selection and analysis is repeated 25 times. The derived SI values from the 25 validation sets are then correlated to the full DIST SI results for the matching test sets to assess any significant loss of correlation when the randomly selected derivation set is isolated from the validation set.
2.7.3. Part Three: Monte Carlo Analysis of the DISTq Method
Finally, a comparison can be made between the coefficient of variation (CV= standard deviation divided by the mean SI) of SIDISTq and the fully sampled SIDIST, to obtain an indication of the expected robustness and error of the DISTq relative to the DIST and the euglycaemic clamp as reported in [17]. A Monte-Carlo analysis of the fully sampled DIST has been previously completed [17], and the procedure of this study is repeated for both the fully sampled DIST and DISTq.
The data used to generate simulation results was taken from 146 euglycaemic clamp tests performed during a lifestyle intervention study on 73 individuals [20]. Virtual C-peptide, insulin and glucose data for a DIST test can be simulated using the physiological model defined by Equations (1) to (5) and an SI value identified from the euglycaemic clamp test results [17]. Virtual discrete “samples” are taken per the DIST protocol definition by isolating the derived concentrations at the appropriate time points. The Monte Carlo simulation adds noise to these virtual samples in accordance with published assay and dosing errors. Further details of the simulation protocol can be found in [17]. Finally, differing random levels of endogenous glucose suppression are also included. Each test is run with random errors 250 times for each trial creating 36500 analyses, which are use to calculate the CV.
The computationally expensive added nL variation method was not applied to minimise computational time. Hence, the results will be conservative in the estimation of the overall DISTq error, without added refinement.
3. Results
3.1. Part One: Clinical Equivalence of the DIST and DISTq Methods
The basic DISTq method showed a strong correlation to the fully sampled DIST test SI (R=0.86), which improved to R=0.91 using the nL parameter variation method. Fig. (5) shows the relationship between the SIDIST solved with the full data set and the iterative-integral method, and the SIDISTq using limited data and the DISTq method.
 |
Fig. (5). Relationships between SIDIST from the fully sampled DIST tests and SIDISTq for the basic DISTq method (left), and with the additional variation of liver clearance cycle (right). |
The correlation between DISTq SI values obtained using initial SI estimates from distant ends of the expected range was perfect (R=1.00), showing that the SI values generated with the DISTq method are independent of the initial SI estimation. Thus, the DISTq method is convex and robust with respect to SI starting value, as it generated identical results, regardless of starting point.
3.2. Part Two: Separating the Derivation Set from the Validation Set
Fig. (6) shows the relationship between the fully sampled SIDIST and SIDISTq when the validation test set is isolated from the set used to derive Equations (14) to (18). Although there is a marginal decrease in the correlation from Fig. (5), a strong correlation is maintained (R=0.83 and R=0.88 for the fixed and variable nL methods respectively). As the simulation method randomly selected different sub-sets of tests to generate population parameters and to validate these, some tests were selected more frequently in the parameter generation than others. However, each trial was part of the validation set at least once.
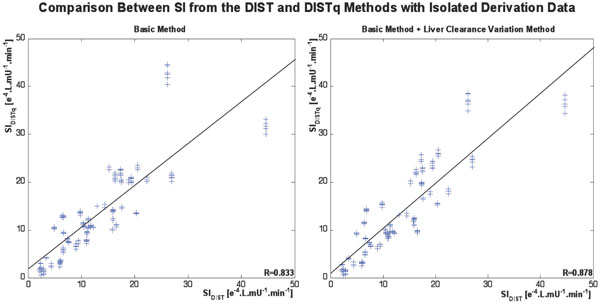 |
Fig. (6). A comparison between the fully sampled SIDIST and the SIDISTq from the DISTq method when the population-based equations (Equations 14-18) are derived using data from a subset of trials which are isolated from the validation set (N=225; 25 iterations with a randomly selected 37 trial equation derivation set, and 9 solved trials per iteration). |
For those data sets in the validation set several times, the vertical clusters of SIDISTq in Fig. (6) show the DISTq variability at different levels of SIDISTq induced by the differences in development data set. Fig. (6) shows that most such results are robust, especially at the clinically more important lower SIDIST levels. However, it is also clear that a larger derivation data set would provide a potentially more robust test. Overall, Fig. (6) does show that the estimates of Equations (14) to (18) are generally stable and effective.
3.3. Part Three: Monte Carlo Analysis of the DISTq Method
The Monte Carlo analysis of the fully sampled DIST test confirmed the results of the initial investigation [17]. These simulations showed a strong correlation between SIDIST and the sensitivity metric of the euglycaemic clamp (ISI) (R=0.92). The correlation is improved when ISI is normalised by the steady state glycaemic concentration achieved during the euglycaemic clamp (ISIG) (R=0.98). This result is very similar to the findings in [17], which found R=0.93 and R=0.99 respectively.
The virtual SIDISTq correlated well to ISI (R=0.81), which again improved when compared to ISIG (R=0.89). The HOMA (homeostatic model assessment) [18] correlation was much poorer when compared to ISI and ISIG (ISI: R=-0.37 and ISIG: R=-0.37). SIDISTq correlated better to SIDIST in this in-silico analysis than the clinical results (R=0.96 compared to R=0.83-0.91).
The potentially most important component of an SI test is the ability to define changes in SI accurately over time, to monitor intervention or treatment. As expected, the DIST test showed a stronger ability to capture the insulin sensitivity shift seen in the euglycaemic clamp tests (R=0.97) than the DISTq (R=0.92). Both DIST methods performed significantly better than HOMA (R=-0.22). Fig. (7) shows the SI shift over four tests, sorted by increasing SI shift according to the clinically measured change in euglycaemic clamp results for the 73 subjects of the lifestyle intervention trial used in the Monte Carlo analysis [20]. It is visually clear that the DIST and DISTq both capture the clinically relevant changes, and that the HOMA metric is not clinically effective for tracking these changes due to intervention or any equivalently modest but clinically significant changes over time.
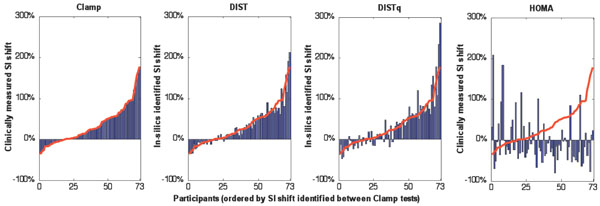 |
Fig. (7). The SI shift measured in-silico by the DIST and DISTq methods compared to the clinically measured euglycaemic clamp and HOMA derived SI shift. The SI values are sorted increasing from left to right by the SI shift observed between euglycaemic clamp tests. The red line shows the clamp derived SI shift overlaid on the results from the other tests. |
This Monte Carlo simulation found a slightly higher average CV for the fully sampled DIST (CV=6.6%) than the value found in [17] (CV=4.5%). The average CV for DISTq was significantly higher (CV=21.2%). Fig. (8) shows that the CV was higher for the more insulin resistant subjects, toward a maximum of 30% for the most insulin resistant subject. The average HOMA CV was significantly lower than the DISTq (CV=10%) but does not capture changes in SI well as seen in Fig. (7).
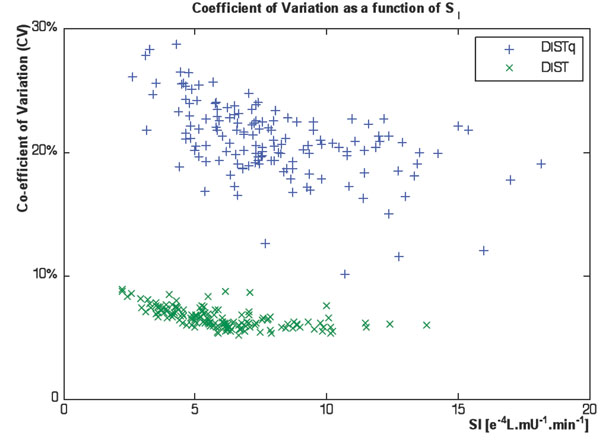 |
Fig. (8). Coefficients of variation from the Monte Carlo analysis of the DIST and DISTq methods. |
4. Discussion
4.1. Correlations and Potential Limitations
A strong correlation between SIDIST and SIDISTq (R=0.91 in Fig. 5) implies that accurate low-cost estimation of SI is possible in clinical real-time with the methods described in this article. This result was obtained based on well-founded inferences into the insulin concentrations in interstitial fluid obtained from fully sampled DIST tests with insulin and C-peptide sampling. Dependable assumptions from the protocol diminish the effects of the error in developing the population parameter estimations. The resulting simulated insulin concentrations are sufficiently accurate to allow good confidence in the derived SI.
Although there is a marginal reduction in correlation when the derivation set is isolated from the validation set, a strong correlation still exists (R=0.88 in Fig. 6). Two possible issues could be the cause of the slight fall in correlation from Fig. (5). First, when the DISTq solver estimates an individual’s SI using population relationships generated from the full subject data set, including data from this particular individual, the accuracy could be positively biased. This concern is allayed when considering that the relationship equations are smooth, and no attempt has been made to fit the population variability in the parameter estimation graphs shown in Fig. (3). Fitting this variation in the population parameter graphs would allow a stronger correlation in this study, but it would be at the expense of applicability of the DISTq method to the wider population.
The second, more likely reason for a loss in correlation is the increasing sparseness of the derivation or development population, which in some cases may be less indicative of the population as a whole. A larger derivation set of full DIST data is not yet available to resolve this issue, but would enable a more refined and conclusive result. Similarly, low dose IM-FSIVGTT data with full insulin and C-peptide sampling could be used with the model of Equations (1) to (5) to enable a larger data set to generate more representative population based insulin relationships shown in Equations (14) to (18).
In particular, the data used in this study was generated during the pilot study of the fully sampled DIST test and is inclusive of tests where the clinical protocol was under development and not necessarily consistent. Furthermore, the dosing level is not consistent as varied dosing levels were part of the pilot study [17]. It is expected that varying the dose would have a proportional effect on Uen. However, upon visual inspection of the relevant relationship graphs in Fig. (3), this expectation did not seem to be consistently the case. There is also a concern that saturation effects at different dosing levels may affect the value of liver clearance nL. Again, visual inspection did not show any significant difference in this case. If sufficient data becomes available with a set protocol and dosing regime, the parameter estimation stage would be stronger and could be fortified with confidence bounds to give a recommendation of the confidence interval of the DISTq derived SI. Such studies are ongoing but data has not yet become available.
4.2. Comparison to Other Tests
The performance of any new test must also be assessed in light of tests of equivalent intensity. The intensity of the DISTq is greater than HOMA, and, in terms of clinician activity, the 2-hr Oral Glucose Tolerance Test (2hr-OGTT), in which an oral load of glucose is ingested and the glucose level is sampled after two hours. In contrast to the HOMA and 2hr-OGTT, which only require a nurse to perform, the DISTq protocol requires a more clinical environment with either nurses or doctors with experience in giving intravenous insulin, who can respond to hypoglycaemia if necessary. The DISTq protocol takes 30 - 45 minutes to perform and includes blood samples every 5 to 10 minutes, which is of greater clinical intensity than the 2hr-OGTT, which only requires one (sometimes two) blood samples. Thus, to be considered as a viable clinical option, the DISTq must predict SI, as well as changes in SI in response to therapy or intervention, with greater accuracy and reliability than either the HOMA or 2hr-OGTT.
The 2hr-OGTT has correlated well to the euglycaemic clamp, achieving R=0.74 [16]. This result is in contrast to a number of studies, which show relatively low repeatability in terms of re-classifying NGT, IGT and T2DM subjects (50-65% repetition) [7, 10, 34]. In contrast, Fig. (7) shows DIST and DISTq should capture changes in SI much better than HOMA, and would likely have similar performance compared to the OGTT as noted above.
The DISTq differs compared to the 2hr-OGTT by the approach in which insulin and glucose are elevated in the test subject. Insulin is not measured in either the 2hr-OGTT or DISTq. However, the DISTq protocol introduces a known bolus of insulin at a known time, which is not done in the 2hr-OGTT. This bolus accounts for the majority of the subjects’ plasma insulin and allows significantly more accurate predictions of the insulin concentration that are not possible in the 2hr-OGTT protocol, which relies only on an endogenous response to a larger glucose challenge. The endogenous insulin response is much more varying within individuals and is harder to predict. In addition, the 2hr-OGTT protocol primarily measures the ability to dispose of glucose, and the efficiency of insulin is not assessed. Thus, the derived metric is not a fully true reflection of SI, but it is instead an overall measure of the ability to dispose of glucose. The 2hr-OGTT metric is thus effective in some clinical scenarios, such as in diagnosing individuals with impaired glucose tolerance (IGT) or type 2 diabetes (T2DM). However, it is not suitable in studies where accurate assessment of insulin sensitivity, or modest changes in this value over time or therapy are critical, such as when monitoring the patient response to drug therapy. Thus the 2hr-OGTT is an accepted crude T2DM diagnostic test, but not effective in tracking or quantifying insulin sensitivity changes.
The HOMA is a simple protocol requiring only one blood sample analysed for glucose and insulin. A simple linear formula then calcualtes an individuals insulin resistance level [18]. However, this simplicity means that the derived metric is not representative of insulin mediated glucose disposal in a dynamic, non-fasting situation. The pulsatile nature of insulin secretion [31, 35] and lag in the insulin-glucose dynamics cause effectively random errors in the derived HOMA metric. The relatively poor correlation of HOMA to the euglycaemic clamp SI metric (ISIG) (R=-0.37) found in this study emphasises the uncertainty created by these fluctuations. Furthermore, Fig. (7) shows that HOMA has a clear inability to capture modest changes in SI due to intervention and therapy. The SIDISTq derived in the Monte Carlo study accurately repeated the clinically observed intervention-driven intra-patient change in ISIG with a correlation of R=0.92. In contrast, the HOMA achieved a much lower R=-0.22 correlation. These results indicate that the DISTq approach should be a better and more effective test in presence of the physiological and clinically induced variations accounted for in the Monte Carlo study.
This strength can be largely attributed to the pacifying effect that a longitudinal intervention study has on the DISTq sub-process that introduces greatest variability. In particular, the primary cause of variability in SIDISTq is the population-based parameter estimation stage (Equations (14) to (18)). The average error between the full DIST solved parameters and the parameters derived from Equations (14) to (18) is approximately 35%. Although this value is significant, the effect on SI is minimised by the specific structure of the DIST protocol and DISTq method. As changes in these estimated parameters are likely to be minimal during a longitudinal study between interventions, or if measured regularly over 3-12 month intervals, the change in SI can be defined by the changes in the gradient of glucose caused by the altered efficiency of the insulin bolus in the subject. Studies that could utilise DISTq include drug trials for enhancing insulin sensitivity and interventional dietary or lifestyle studies.
Although the prediction capability of the DISTq method exceeds that of tests with similar intensity, the CV of the derived metric is relatively high. The CV of 21% predicted by the Monte-Carlo simulation is higher than what would be expected in the 2hr-OGTT or the HOMA. However, for diagnostic purposes this effect can be ameliorated. In particular, the stored blood samples from borderline diagnoses could be analysed for insulin and C-peptide and an SI value found using the full DIST analysis. Thus, an SI value with a much greater certainty could be estimated (CV=4-6%) and the subject would not have to participate in another test. Although, this solution would eliminate the real-time capability of the test for cases with borderline DISTq results, it would only be necessary in limited cases needing more resolution.
4.3. Clinical Impact, Issues and Limitations
The area of significant clinical interest is the lower end of the SI scale (1.0-5.0 e-4L·mU-1·min-1), as most individuals with diabetes risk would fall into this range [24]. The CV of the DISTq is highest in this range due to a number of factors in the method and protocol. The small glucose disposal rate variations generated by the Monte Carlo simulation alter the SI predictions. In particular, small shifts in this SI have a greater effect on the unknown parameter estimation sub-process as the equation gradients are highest in this range. The re-simulated insulin concentration profile would incline SI further in the direction of any noise generated change. This error and its propagation is unavoidable with this method. The higher gradients in this range are necessary to capture the rapid increase in pancreatic insulin output and basal insulin concentration found in some pre-diabetic states. However, again, any borderline diagnosis with a DISTq could result in a more accurate DIST being done with stored blood, as only the assays used are different between DIST and DISTq analyses. As a result, expensive insulin and C-peptide assays are taken only where needed and a hierarchy of tests is enabled.
This variability in metabolic response to the test for subjects with low SI increases the parameter estimation uncertainty in the low SI region for the DISTq. The increase in error is partly a result of the nature of the natural progression of type 2 diabetes. A newly diagnosed type 2 diabetic individual can exhibit a low SI with very high basal insulin concentrations and high second phase insulin secretion (Uen). In contrast, a long-term type 2 diabetic individual with the same or very similar SI may have either exhausted or significantly diminished beta cell function, resulting in very low basal and second phase insulin secretion levels. Hence, there are two very similar SI values with markedly different endogenous insulin responses depending on time of exposure to the disease. This characteristic can be observed as the “trumpet” shape seen in the parameter estimation graphs of Fig. (3) at a low SI. Accounting for these differences remains a topic of future research.
The clinical real-time capability of the DISTq may allow new applications to benefit from SI testing. Glycaemic control and sepsis diagnosis in an intensive care environment could be improved [19]. It may also aid the planning of glycaemic regulation for newly diagnosed diabetic individuals. Further research must be undertaken to ensure that the protocol is suitable, and that the population-based equations are relevant in these situations.
5. Conclusions
Accurate SI estimation is possible in clinical real-time with only glucose samples using the DIST protocol and a number of population based parameter assumptions. There is a strong correlation between fully sampled SIDIST and SIDISTq of R=0.91, which is maintained outside the parameter estimation population. The method is robust as the protocol avoids saturation characteristics and allows very good assumptions about an individual’s insulin concentrations.
When choosing an insulin-sensitivity test the clinician or researcher should decide what level of resolution, intensity, cost, complexity, speed and confidence is best suited for that particular application or study. The DISTq is not an answer for all of these purposes, but should be considered when a low intensity, very inexpensive, but relatively accurate estimation of SI is desired. The low cost and relatively low intensity for the accuracy and resolution delivered may allow greater numbers to be studied or tested. The test requires advanced mathematical processes, but once provided, the data can be analysed and delivered in clinical real-time and the researcher or clinician can thus get a result immediately.