
RESEARCH ARTICLE
Parametric Analysis of Orthopedic Screws in Relation to Bone Density
Elisabetta M Zanetti*, 1, Massimiliano Salaorno1, Giovanni Grasso1, Alberto L Audenino2
Article Information
Identifiers and Pagination:
Year: 2009Volume: 3
First Page: 19
Last Page: 26
Publisher Id: TOMINFOJ-3-19
DOI: 10.2174/1874431100903010019
Article History:
Received Date: 23/1/2009Revision Received Date: 22/2/2009
Acceptance Date: 18/3/2009
Electronic publication date: 21/4/2009
Collection year: 2009
open-access license: This is an open access article licensed under the terms of the Creative Commons Attribution Non-Commercial License (http://creativecommons.org/licenses/by-nc/3.0/) which permits unrestricted, non-commercial use, distribution and reproduction in any medium, provided the work is properly cited.
Abstract
A global study of geometry and material properties of orthopedic screws was performed, considering not only the effect of each single factor (screw pitch, number of threads, fillet angle, etc.) but also their interactions with respect to bone density.
The stress patterns resulting from different screw geometries and bone densities were analyzed using finite element techniques, taking into account different levels of osseointegration between the screw and the bone. These numerical models where validated through experimental pull-out tests, where a pull out force of 120 N produced localized failure of the last thread (stresses above 0.42 MPa). The results of the numerical simulations were then summarised using a multi-factorial parametric analysis. This demonstrated the great relevance of the interaction between bone density and screw pitch, showing that the optimal screw pitch can vary by more than 25% for different densities (0.35 g/cm3 and 0.47 g/cm3, respectively).
The parameters calculated by means of the multi-factorial analysis allow the pull out force to be estimated for different osseointegration levels, different screw geometries and material properties, and for different bone densities. The final objective is to determine the best choice of implant for each individual patient.
1. INTRODUCTION
The pattern of stresses transferred to the bone have great influence on the success or failure of an orthopedic implant. The evaluation of bone stresses is so complex that it cannot be accomplished analytically, necessitating the application of FEA (Finite Element Analysis) techniques; three types of FE model, axisymmetric, bi-dimensional and three-dimensional, are considered in the literature [1-5]. Two-dimensional models are flawed in that stresses outside the plane of analysis are disregarded, while 3D models require a large number of elements and, consequently, long calculation times. The axisymmetric model, where the only simplification is that the screw thread is modeled as a disk, can be considered a good compromise between 2D and 3D models.
With regard to the constraints, the condition of osseointegration is usually simulated, and the post-operative condition it is rarely considered in the literature [3, 4, 6]. However, these two conditions produce significantly different results and can be considered the limit conditions under which orthopedic screws operate, so that the analysis of both cases can provide useful information.
Two boundary conditions (pull out test; alternative condition) are simulated in the literature [4, 7], but the relation between their respective results has not been analyzed. This relation is relevant because the pull out test is the standard test for orthopedic screws, while the screws, once implanted, are subjected to different loading conditions.
Regarding bone material, most models in the literature consider bone an isotropic, elastic and homogenous material [1-4, 7-9], while in reality bone is anisotropic because of its trabecular structure. In this study, bone isotropy was assumed in order to obtain more general results, while bone structure was defined by a single parameter, its volumetric density.
In the literature, the geometric and mechanical parameters of the screw generally considered are: pitch [10, 11], length, flank angle, and material [2-5]. Few authors have considered the fillet radius [4, 7], while many models have sharp edges [1, 3, 12]. Little emphasis has been given to screw performance in relation to bone density [5, 13] even though it is well known that the density of the bone determines its mechanical properties [14-18].
The present study evidences that it is not possible to select the appropriate screw without considering bone density. Different models were developed, considering the geometry and mechanical properties of commercial screws, and a parametric analysis was undertaken to assess how the strength of the bone-screw system varies for different values of thread pitch and bone density. Actually, this paper introduces a methodology where a multi-parametric structural numerical analysis is integrated with a multi-factorial analysis in order to be able to summarize a great amount of results and to build predictive analytic models. Overall, it was possible to determine some criteria for system optimization.
2. MATERIALS AND METHODOLOGY
Stress analysis required the construction of apposite FE models, which were then validated by means of experimental tests.
2.1. Finite Element Model
The model shown in Fig. (1) was developed using MSC MARC® 2003 software.
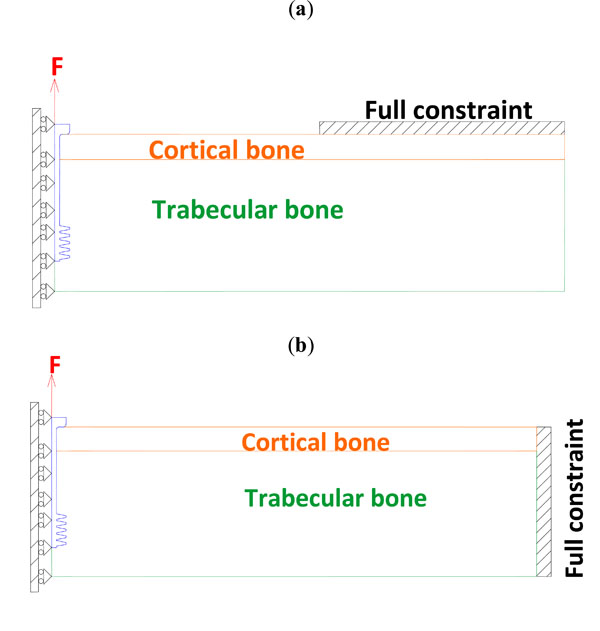 |
Fig. (1). Set-up for FE pull out test (a) and alternative loading condition (b). |
The bone consists of cortical bone (E =11 GPa, ν=0.33, 5 mm in thickness) and trabecular bone. Two different trabecular bone densities were simulated (Table 1), and their respective mechanical properties were obtained from the relations [14, 16]:
Mechanical Properties of Trabecular Bone as a Function of Bone Density
| Density [g/cm3] | Young’s Modulus [MPa] | Ultimate Stress [MPa] |
|---|---|---|
| 0.35 | 147 | 0.57 |
| 0.47 | 300 | 1.24 |
 |
(1) |
 |
(2) |
where:
ρ is bone density (g/cm3);
E is Young’s modulus (MPa);
σU is the ultimate tensile stress (MPa).
The bone density values were chosen to simulate recurrent clinical situations (adult patient with mild bone resorbing) and significantly different Young’s modulus (1:2 ratio).
With regard to the screws, four different constitutive materials were simulated in order to study both currently used materials such as stainless steel (screw models n. 9-10) and titanium Ti6Al4V (screw models n. 3-8), and more innovative solutions such as low stiffness titanium (Ti12Mo5Ta, screw model n.2) and PMMA reinforced by an inner Ti12Mo5T cylinder (screw model n.1); the last two materials have been chosen in order to better approach trabecular bone’s Young modulus.
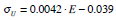
The general geometry of the simulated screws and the mesh details are shown in Fig. (2) (symbols as in Table 2); they were generated from an effectively produced geometry (screw model n. 9), varying all parameters, one by one.
Geometric Parameters of Screws
| Screw Model | N | de (mm) | dn (mm) | RT (mm) | RF (mm) | α | β | Escrew (GPa) | Eext (GPa) | L (mm) |
|---|---|---|---|---|---|---|---|---|---|---|
| 1 | 5 | 6 | 2 | 0.5 | 0.10 | 10 | 0 | 74 | 3.2 | 27 |
| 2 | 5 | 6 | 2 | 0.5 | 0.10 | 10 | 0 | 74 | - | 27 |
| 3 | 5 | 4 | 2 | 0.5 | 0.10 | 10 | 0 | 105 | - | 27 |
| 4 | 5 | 6 | 2 | 0.5 | 0.10 | 10 | 1 | 105 | - | 27 |
| 5 | 5 | 6 | 2 | 0.5 | 0.10 | 10 | 2 | 105 | - | 27 |
| 6 | 5 | 6 | 2 | 0.6 | 0.10 | 10 | 0 | 105 | - | 27 |
| 7 | 5 | 6 | 2 | 0.5 | 0.10 | 10 | 0 | 105 | - | 27 |
| 8 | 5 | 6 | 2 | 0.5 | 0.15 | 10 | 0 | 105 | - | 27 |
| 9 | 5 | 6 | 2 | 0.5 | 0.10 | 10 | 0 | 186 | - | 27 |
| 10 | 5 | 6 | 2 | 0.5 | 0.10 | 10 | 0 | 186 | - | 33 |
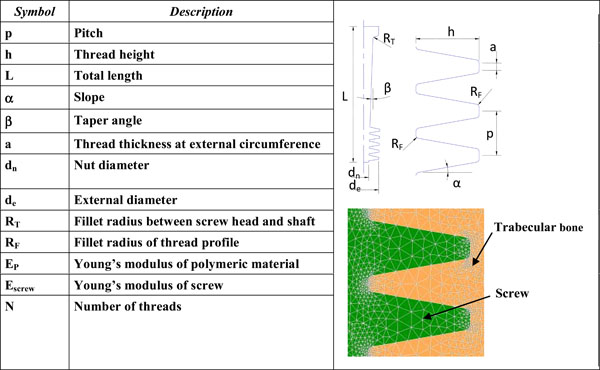 |
Fig. (2). Screw parameters and detail of mesh. |
All the screw threads were simulated with symmetrical flanks, fillet radii were all equal, and the pitch was constant along the screw axis. The axisymmetric model entails shorter calculation times.
The constraints and boundary conditions are shown in Fig. (1): they correspond to the pull out test (Fig. 1a) or to an alternative condition, with a different position of the constraint (Fig. 1b); this alternative condition should represent a more realistic working condition. According to Saint Venant’s, the second condition is equivalent to the first one, however the small displacement hypothesis cannot be assumed a priori in this case, due to the low stiffness of trabecular bone. For both configurations, the immediate post-operative condition and that of complete osseointegration were simulated: the first condition was created through a ‘touch’ contact between the screw and trabecular bone (whatever displacement is allowed with the exception of penetration), while the second was obtained through a ‘glue’ contact (the two components are completely bounded to each other).
The mean number of elements per model was 7500.
2.2. Maximum Allowed Force Evaluation
The maximum allowed force was calculated by iteration (non-linear case), specifying that the maximum stress on the bone must not exceed its ultimate tensile stress. This hypothesis is quite restrictive: actually bone is not a fragile material, tension peaks produce localized plastic deformations and stresses are redistributed over a wider area. However bone is likely to be stressed by dynamic loads and fatigue damage may occur when stress peaks produce a crack which progressively propagates during loading, until structural failure occurs.
2.3. Experimental Tests
The finite element model with ‘touch’ boundary condition was validated by means of experimental tests. All tests were performed on an hydraulic INSTRON 8872 test machine, equipped with a ±5 kN load cell.
Pull out tests [19] were conducted replacing bone by polyurethane foam, as reported in the literature [20].
The mechanical properties of polyurethane foam were determined by ten compression and ten tensile static tests, where a linearly increasing displacement was applied. The nominal stress was calculated from the force, divided by the initial specimen section; the nominal strain was calculated from the current displacement, divided by the initial specimen height.
Young’s modulus was determined through five dynamic tests, applying a pulsating sinusoidal load (Fig. 3, left).
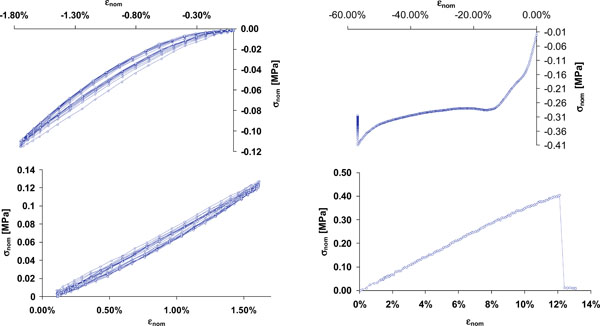 |
Fig. (3). Curves of compression (upper) and tensile (lower) tests on polyurethane foam: nominal stress (σnom) versus nominal strain (εnom). |
Young’s modulus was calculated as 6 MPa (s.d. = ± 1.21 MPa), while ultimate tensile stress was 0.42 MPa (s.d. = ± 0.084 MPa); these data were input into the numeric model to be validated. Compression tests produced a progressive packing of the foam (reaching up to 60% height reduction) which does not break but shows buckling.
The pull out tests required specific equipment: two holes drilled in the opposite sides of a rectangular metal profile (obtained from an extruded bar) and a polyurethane block was placed within the box profile (Fig. 4).
 |
Fig. (4). Set-up of pull out test and load vs displacement curve. |
A bolt screwed into the lower hole was then held by the lower jaw of the machine (the bolt was left free to move in the cross-sectional plane, in order to avoid bending moments acting on the screw). A screw was inserted through the upper hole and inserted into the polyurethane foam. The metal profile simulated the cortical layer of the FE model, and prevented the polyurethane foam deforming when the screw was pulled. A preparatory hole (6.5 mm in diameter) was drilled in the foam before inserting the screw, which was always set at the same height. The tests were conducted on a standard metrical screw (M10, UNI 4536) whose geometry was known in detail, allowing an accurate FE model to be constructed. The lower end of the shaft was threaded with 17 threads.
The screw was pulled at a speed of 2 mm/min. The pull out test was repeated 23 times and the mean force determined was 120 N (s.d. = ±14 N). A typical force versus displacement curve is shown in Fig. (4).
2.4. Analysis of FE Model Results
Ten different screw models were realized (Table 2). Each model was implemented with four different pitches (1.4 mm, 2.4 mm, 3.4 mm, 4.4 mm) and two different values of bone density (0.35 g/cm3; 0.47 g/cm3). Overall, each screw model was analyzed in eight FE models. The numerical results were summarized through a multifactor model [22], examining both the effects of each single factor and the interaction between the pitch and bone density.
 |
(3) |
where:
Y = pull-out limit load; d = bone density; p = pitch μ = mean
β = linear effect of bone density
γL = linear effect of the pitch; γQ = square effect of the pitch
γC = cube effect of the pitch
βγL = effect of interaction between the pitch and bone density
βγQ = effect of interaction between the bone density and the square effect of the pitch
βγC =effect of interaction between the bone density and the cube effect of the pitch
Up to the third power of p could be considered because four different pitches were simulated; the only linear effect of bone density could be considered because only two density values have been simulated.
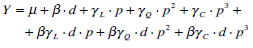
Eq. (3) can be reformulated in order to isolate the contribution of the screw diameter:
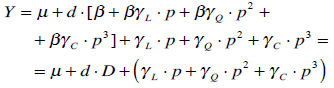 |
(4) |
or in order to isolate the contribution of the screw pitch:
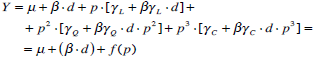 |
(5) |
The coefficients of this numerical model were calculated for every screw, solving a mathematical system with eight parameters (the effects) and eight equations (pull out forces, calculated from the FE models).
3. RESULTS AND DISCUSSION
3.1. Validation of FE Model
In order to validate FE models, it is necessary to select a failure criterion. The experimental tests showed that the polyurethane foam exhibited fragile behavior in the tensile tests, while compressive tests were much less critical. The maximum (positive) main stress failure criterion was chosen with an ultimate tensile stress of 0.42 MPa.
As shown in Fig. (5), the experimentally evaluated pull out force (120 N) generates ultimate tensile stresses at the last thread, close to the fillet. The FE model is therefore validated because it correctly predicts a localized failure when the pull out force is applied.
 |
Fig. (5). Maximum principal stresses (left and center) and equivalent Von Mises stresses (right). |
Actually this validation is quite specific: it has been demostrated that FE model correctly predicts the failure load which is the object of this paper; a more detailed validation would be required if other information were sought from the finite element model (stiffness behavior, stress distribution, etc.).
The location of ultimate tensile stress at the last thread may be unexpected, given that in the literature, the first thread is considered the most critical [21]. However, the pull out test is a static test, while the above considerations refer to fatigue life. Further, the mechanical behavior of threaded joints using polyurethane foam (or bone) differs from the behavior of metal joints: both foam and bone are porous, leading to completely different modalities of failure for tension and compression. The first “female” thread is subjected to compression stresses (contact between the screw and the bone), while the last is subjected to tensile stresses (as evidenced in Fig. 5).
3.2. Multifactor Analysis
The results of the multifactor analysis are illustrated in Fig. (6), where the trends of the ‘f(p)’ function (eq. 5) vs pitch are plotted for different screw models, bone densities and boundary conditions (post-operative or complete osseointegration). Table 3 shows the values of the D coefficient (eq. 4) reported for different screw models.
D[10-3Nm3/kg] from Eq. (5)
| Pull Out Test (Touch) | |||||||||||
|---|---|---|---|---|---|---|---|---|---|---|---|
| Screw Model | 1 | 2 | 3 | 4 | 5 | 6 | 7 | 8 | 9 | 10 | |
| 1.4 | D | 162.5 | 125.0 | 75.0 | 100.0 | 104.2 | 91.7 | 91.7 | 133.3 | 100.0 | 87.5 |
| 2.4 | D | 191.7 | 116.7 | 83.3 | 112.5 | 125.0 | 108.3 | 108.3 | 158.3 | 104.2 | 120.8 |
| 3.4 | D | 179.2 | 129.2 | 100.0 | 137.5 | 175.0 | 125.0 | 145.8 | 191.7 | 145.8 | 116.7 |
| 4.4 | D | 104.2 | 175.0 | 83.3 | 150.0 | 191.7 | 137.5 | 145.8 | 191.7 | 145.8 | 141.7 |
| PullOut Test (Glue) | |||||||||||
| 1.4 | D | 341.7 | 483.3 | 508.3 | 454.2 | 391.7 | 416.7 | 441.7 | 441.7 | 525.0 | 412.5 |
| 2.4 | D | 300.0 | 475.0 | 483.3 | 420.,8 | 458.3 | 470.8 | 508.3 | 537.5 | 533.3 | 504.2 |
| 3.4 | D | 300.0 | 454.2 | 500.0 | 495.8 | 458.3 | 470.8 | 512.5 | 529.2 | 554.2 | 462.5 |
| 4.4 | D | 408.3 | 583.3 | 566.7 | 625.0 | 575.0 | 633.3 | 616.7 | 575.0 | 716.7 | 579.2 |
| Alternative Condition (Touch) | |||||||||||
| 1.4 | D | 133.3 | 125.0 | 62.5 | 91.7 | 87.5 | 83.3 | 87.5 | 125.0 | 91.7 | 87.5 |
| 2.4 | D | 170.8 | 116.7 | 75.0 | 116.7 | 125.0 | 108.3 | 100.0 | 158.3 | 112.5 | 116.7 |
| 3.4 | D | 170.8 | 137.5 | 83.3 | 133.3 | 141.7 | 108.3 | 150.0 | 187.5 | 137.5 | 125.0 |
| 4.4 | D | 108.3 | 145.8 | 87.5 | 154.2 | 187.5 | 141.7 | 145.8 | 191.7 | 141.7 | 133.3 |
| Alternative Condition (Glue) | |||||||||||
| 1.4 | D | 362.5 | 537.5 | 525.0 | 470.8 | 354.2 | 450.0 | 470.8 | 395.8 | 520.8 | 416.7 |
| 2.4 | D | 312.5 | 408.3 | 508.3 | 533.3 | 479.2 | 404.2 | 537.5 | 558.3 | 541.7 | 445.8 |
| 3.4 | D | 312.5 | 466.7 | 483.3 | 529.2 | 466.7 | 466.7 | 566.7 | 500.0 | 562.5 | 487.5 |
| 4.4 | D | 420.8 | 620.8 | 570.8 | 720.8 | 575.0 | 641.7 | 683.3 | 512.5 | 691.7 | 591.7 |
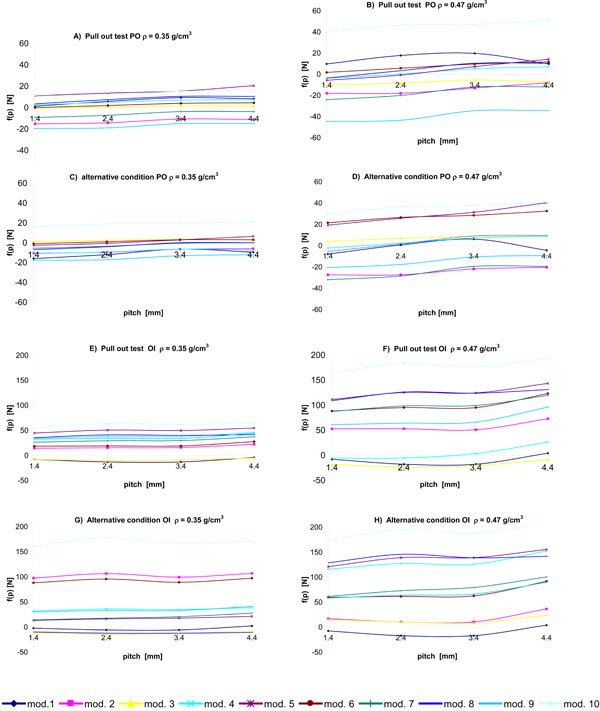 |
Fig. (6). 
|
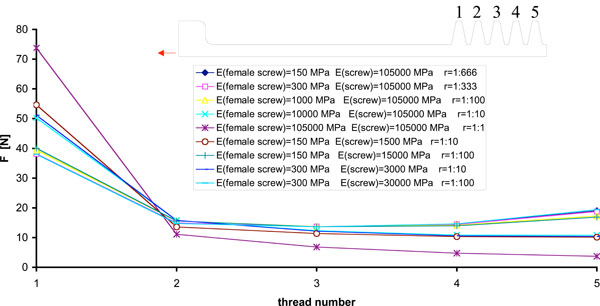 |
Fig. (7). Load distribution between screw and “female” thread for different materials. |
Some considerations can be made:
- In general, the differences in the stress distribution between pull out and the alternative constraint condition (with all other conditions constant) are minimal: the position of the full constraint does not influence the stress pattern on the “female” thread. In this sense, the pull out test is representative of a wide range of operating conditions.
- The post-operative and full osseointegration conditions are very different: the latter is more sensitive to bone density (in Table 3 the D coefficient values calculated for the post-operative condition are lower than that calculated for complete osseointegration) and to thread pitch (in Fig. (6), curves B, D, F are steeper than curves A, C, E). This can be explained considering that, in full osseointegration, the screw and the bone are forced to undergo the same deformation. The post-operative condition is more critical because a lower pull out force is required. It is therefore advisable to construct non-linear numerical models where this situation is analyzed, implementing a ‘touch’ contact between the screw and bone.
- The coefficients of eq. 5 vary from model to model.
- The influence of pitch varies more for high values of bone density (Fig. 6). Effectively, greater bone stiffness implies a greater sensitivity to thread geometry because stresses are more localized.
- For a given screw, the optimal pitch (that providing maximum pull out force) is not always the maximum simulated pitch. For example, in the pull out test regarding the post-operative condition, given the screw model N. 8, the optimal pitch is between 3.4 and 4.4 mm for a bone density of 0.35 g/cm3, while the optimal pitch is between 2.4 mm and 3.4 mm for a bone density of 0.47 g/cm3.
- With regard to the interaction between the pitch and bone density, coefficients βγL, βγQ and βγC can assume either positive and negative values (for example, βγL>0 in the screw model 1, while βγL has a negative value in model 2). This means that in some models, the effect of bone density on pull out force is smaller for greater pitches. This result further confirms the conclusion that the optimal screw geometry will be different for different bone densities.
- Many screw models show a similar pattern of function p vs pitch (Fig. 6).
- There is a difference between load distribution in mechanical threaded joint and biomechanical threaded joint, as demonstrated by further numerical models, which implemented different values of “r”, the parameter which defines the ratio between the Young’s modulus of bone and that of the screw (Fig. 7). In the biomechanical case, r is very low because the Young’s modulus of bone is approx. 300 MPa, while the Young’s modulus of the screw is about one thousand times greater. Conversely, they have similar values in the mechanical and consequently a much more homogeneous load distribution is obtained on the second, third and fourth threads the biomechanical case.
- According to our results, screw model n. 10 is generally to be preferred; the performance of this model is moderately influenced by the thread pitch; considering the post-operative condition which is the most critical, a pitch larger than 1.4 mm should be recommended for the higher bone density.
4. CONCLUSIONS
An FE model of the bone-screw system was constructed and experimentally validated. The model evidenced that the pull out test, the standard test for orthopedic screws, is representative of the operating conditions.
It was demonstrated that the hypothesized level of osseointegration has a significant effect on the results obtained.
In the light of this study, it is clear that the optimal screw geometry depends on the bone density: the pitch producing a higher load changes as a function of different bone densities (for example, in screw model 1 the optimal pitch is 3.75 mm for a bone density of 0.35 g/cm3, against 3.13 mm for 0.47 g/cm3, while for model 2 the optimal pitch is 3.87 mm for a bone density of 0.35 g/cm3 against 4.93 mm for a density of 0.47 g/cm3).
It was found that threaded joints cut for biomechanical applications have some particularities compared to classic mechanical threaded joints: bone is much more compliant compared with the material of the screw and consequently a more homogenous load distribution over the threads can be obtained. Further, bone is porous and shows very different compression/tensile behaviors.