
RESEARCH ARTICLE
Quantitative Texture Analysis and Transesophageal Echocardiography to Characterize the Acute Myocardial Contusion
Abdelaziz Amichi*, 1, Pascal Laugier2
Article Information
Identifiers and Pagination:
Year: 2009Volume: 3
First Page: 13
Last Page: 18
Publisher Id: TOMINFOJ-3-13
DOI: 10.2174/1874431100903010013
Article History:
Received Date: 8/6/2008Revision Received Date: 24/6/2008
Acceptance Date: 16/2/2009
Electronic publication date: 21/4/2009
Collection year: 2009
open-access license: This is an open access article licensed under the terms of the Creative Commons Attribution Non-Commercial License (http://creativecommons.org/licenses/by-nc/3.0/) which permits unrestricted, non-commercial use, distribution and reproduction in any medium, provided the work is properly cited.
Abstract
Myocardial contusion (MC) is a common injury following blunt chest trauma without any specific symptoms.
Several techniques such as electrocardiogram, estimation of myocardial band fraction of creatine phosphokinase, chest radiography and the scintiscanning missed efficiency to characterize the MC.
Another technique based on transesophageal echocardiography [TEE] allows to visualize the structures of the heart with a good spatial resolution.
We postulated that the quantitative texture analysis of regional image texture in two- dimensional [2D] TEE echocardiograms would be an accurate method to differentiate normal from abnormal myocardial wall.
This preliminary experimental study demonstrated the feasibility of the proposed technique.
1. INTRODUCTION
Myocardial Contusion Description:
Myocardial contusion [MC] is a common injury following blunt chest trauma without any specific symptoms [1, 2]. It occurs in 5 - 15 % of polytraumatized population, according to the studies published in the literature [3].
There is a substantial confusion concerning the diagnosis, and the definition of myocardial contusion which is not entirely clear [1].
MC can induce severe complications [arrhythmias, hypotension, shock], of which most frequent is represented by the disorders of the cardiac rhythm [2].
Myocardial contusion is characterized on microscopical examination, by focal hemorrhages with hematoma formation, as well as myofibrillar fragmentation in the wall of the heart [10, 11, 12]. The interface between the area of normal and contused tissue due to the variation of the echo reflective which increase the brightness of the ultrasound reflection [10]. Myocardium wall is defined as [8], as follows: normal = 0; hypokinetic, [reduction of endocardial motion and thickenning] = 2; akinetic, [virtual absence of inward motion and thickening] = 3; dyskinetic, [paradoxic wall motion away from the center of the left ventricle in systole] = 4. Myocardial contusion was defined as a grade 2 or more segmental wall motion abnormality [9].
Human observation reported that, the distinctive echocardiographic feature of myocardial contusion related to an increased brightness of the ultrasonic reflections from the contused area [10].
Method to Characterize MC:
Several techniques are used to characterize MC [1], such as electrocardiogram, the estimation of myocardial band fraction of creatine phosphokinase, the chest radi+ography and the scintiscanning. Unfortunately, these techniques missed the efficiency to characterize the MC [3, 4, 6, 7] through another acquisition technique, based on the transoesophagien echocardiography [TEE] [5], anatomical structures, cardiac and vascular and hemodynamic functions on the polytraumatized patients with high quality of images, can be obtained.
Several studies have proved that TEE can provide high-quality images [13], great sensitivity to diagnose the myocardial disease compared to echography transthoracic. The TEE may visualize segmental wall motion abnormalities which are interpretated as contusion, in patients without previous myocardial infarction or coronary artery disease [9, 14].
The 2D-echocardiography image is essential to evaluate the pathologies of the cardiac muscle and specially the MC. In case of blunt chest polytraumatized patients, MC is identified qualitatively [1, 2] and quantitatively [3] respectively on the echographic image by:
- An increase thickness of the myocardium at the end of the diastole.
- An increase in the reflectivity of the echoes coming from the area contuse.
- The measurement of the systolic ventricular function which changes when the myocardium is contused [9].
Quantitative Ultrasound Tissue Characterization:
is developed since many years in cardiology. It is a different tool which allow the assessment of certain physical feature of biological tissue based on tissue acoustic properties. Most studies, concern the estimation of the backscatter coefficient [24, 25]. In the case of a healthy heart, this parameter follows the variation of those of the cardiac cycle [24]. In the case of an acute ischemia, the amplitude of the cyclic variation decreases [25]. The cyclic variations of the backscatter coefficient change with an hypertrophic cardiomyopathy or an acute rejection.
Quantitative Texture Analysis:
The texture analysis is an another approach of clinical echocardiographic image analysis. The echocardiographic image texture is related to the random interferences on the transducer surface between the waves scattered by the scatterers (small structures). Our interest is based on myocardial texture analysis of 2D echocardiography could identify the alterations attributed to abnormal tissue. The texture measurements are based on statistical descriptions of the spatial distribution of gray levels.
In the literature, quantitative texture analysis has been reported to allow identification of contused myocardium by analysis of gray level distribution in a caninemodel of myocardial contusion [25].
It has been observed that several parameters derived from the texture analysis [TA.] are discriminating. In addition, the contused area is strongly echoic. The observation shows the difference in the gray levels between the contused and normal areas i.e. the gray level of the former is higher than the latter. It is important to note that no investigations made so far on the subject.
Among these methods used in such approaches, there are also statistical approaches based on:
- The first order statistics which exploits notably the histogram of gray level by measure of gray level average, the variance or the moments of superior degree [21]. The Max-Min, developed initially by Mitchell [22], is an algorithm which measures the local extrema of signal and of which the textural parameters (slope and intercept) can be used to discriminate the different textures.
- The second order statistics is based on density of probabilities of a group of pixels (minimum two pixels) and takes into consideration the relation of spatial dependence between the pixels.
Haralick [23] describes eight statistical approaches which permit the measuring and characterization of texture. The robust methods more often used are the co-occurrence matrices and run length matrices.
The purpose of our study concerns the altered acoustic properties of acute myocardal contusion. This could be determined by a quantitative analysis based on texture analysis and statistical classification (Leave-one-out and multivariate method) of two-dimensional transesophageal echocardiography.
2. METHODS AND MATERIAL
2.1. Selection of Patients
The study deals only with patients who had suffered from blunt chest trauma and benefited through transesophageal echocardiography exam.
Patients suffering from a previous coronary artery disease or having a chronic or acute pathology of the esophagus (contraindicating for transesophageal echocardiography exam) were excluded segmental wall motion abnormality was semi-quantitatively graded by two echocardiographic images of 19 patients (Table 1) with segmental wall motion abnormalities, considered to be related to myocardial contusion were further analyzed. The echography exam for all patients was taken at Henri Mendor hospital, reanimation department.
Demographic SAPS
| Age | 26±10 [Years] [Men] |
|---|---|
| Injury Severity Score | 48 ± 11 |
| Simplified acute physiological score [SAPS] | 16 ± 2 |
From each image, a region of interest at end-diastole and end-systole is taken, and 2D spatial distribution of gray level data was evaluated using three sets of quantitative texture measures. These sets of texture parameters were extracted from the first order statistics (gray level histogram & Max-Min algorithm) and the second order statistics [run-length matrix and co-occurrence matrix].
The texture parameters were calculated for each region of interest using software written in the C programming language and developed in our laboratory.
2.2. Transesophageal Echocardiography Exam
The echocardiographic images were obtained using a 5.0 MHz phased-array biplane transducer mounted to the end of a 100 cm gastroscope interfaced to an ultrasound unit ( Diasonic® [CFM 750]). The patient fasting overnight, his oropharynx was anesthetized with viscous and spray lidocaine to reduce (diminish) gagging, retching and laryngospasm during the procedure. Intravenous midazolam hydrochloride was given to reduce anxiety and provide sedation and amnesia for a modestly unpleasant procedure. A blood pressure monitoring and a pulse-oxymeter were also connected to the patient’s arm. The examination room was equipped with suction apparatus, oxygen, anesthesia bag, face mask and oral airway to face any emergency during the operation.
The patient lied on his left side, facing the examiner. This position reduces the possibility of aspiration. The patient’s head was comfortably flexed to facilitate oropharyngeal entry. With the probe in the mid-esophagus and slightly retroflexed, a four-chamber view of the heart could be obtained. All patients were mechanically ventiled.
During the echography exam, the probe was positioned to visualize the short axis-view of the left ventricle at the mid papillary muscle level. The use of the oesophagien way avoids the pulmonary parenchyma that could be an obstacle for the ultrasounds propagation. The images were acquired by using high ultrasound frequency and the probe was closed to the heart organ. Only the short axis view of the left ventricle at the mid-papillary muscle level was evaluated.
2.3. Data Acquisition and Image Digitization
The acquisition based on transesophageal echocardiography allowed to visualize the structures of the heart with a good spatial resolution. The ultrasonic beam, in this case, did not find an obstacle to cross the thoracic wall. Images corresponding to end diastolic and end-systolic were then stored.
End-diastole was defined as the point in the cardiac cycle at the onset of the electrocardiographic R wave. End-systole was defined as the time of apparent minimal left ventricular chamber size and occurred near the peak of the T wave. One cardiac cycle (RR waves) was automatically divided into 12 frames independent of heart rate, and the images corresponding to the end-diastolic and end-systolic phases were selected with optimal visualization of the interventricular septum and left ventricular posterior wall.
For each frame of the short-axis view at end-diastole and at end-systole, four regions of interest (R.O.I.) were selected, manually using commercial software (L.U.I.S® 1.01..), corresponding to the posterior, the anterior, the septal and the lateral walls of the left ventricular in both end systole and end diastole, including only the myocardium and excluding the endocardial and epicardial specular echoes to avoid areas of echo dropout and obvious artifacts. The selected echocardiographic images recorded on videotape were digitized offline by a frame grabber [Bioscan Snaphot®, Washington]. The images selected to be treated were converted into frame of 512 x 512 pixels of 256 gray levels each [0 = black, 255 = white]. Each region of interest had 1cm2 *size.
Segmental wall motion abnormalities related to myocardial contusion, were found out in the anterior wall in six patients, in the posterior wall in five patients, in the septal wall in seven patients and in the lateral wall in one patient.
Quantitative Texture Analysis [TA] on TEE. images provided information which could be useful for diagnosis aid of MC.
The TA was used on echographic images to accurately identify ischemic and contused myocardium in animal models [10, 11, 15]. It has also been applied to identifying amyloid [14], hypertrophic cardiomyopathies [17], myocarditis [18] and myocardial ischemia [19] or viable myocardium [20].
2.4. Quantitative Texture Analysis
The aim of this approach is to characterize the stochastic proprieties of spatial distribution of the gray level of image. The statistical approach is used when the extraction of primitive and spatial organization is not evident. The ultrasound field is defined as a stochastic environment or quasi stochastic (micro-textures). The basic primitive is then reduced to the whole pixel or to one pixel which is named as the microscopic texture [27]. The statistical approaches are the better and the adapted method to analyze the micro-textures tied to the stochastic distributions of echographic images.
Among these methods used :
2.4.1. First Order Statistical Parameters
2.4.1.1. Gray Level Histogram Statistics
The gray level histogram is defined as the complete frequencies Xi of image gray level. The element of histogram Xi is defined as:
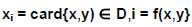
D: discreet domain, i: a gray level at the positions [x, y], f: image function.
Several parameters extracted have described quantitatively the shape of the histogram as: The mean (µ) gray level, The standard deviation (σ), Signal to noise ratio [SNR] of gray level, skewness, Kurtosis. These parameters are described in more details by Pratt [21].
2.4.1.2. MAX-MIN Algorithm
The aim of the algorithm described by Mitchell et al. [24] is to extract the information contained relative occurrence of local extrema of the envelope signal. This algorithm determines the number of local gray level maxima and minima (extrema) of video signal, through a smoothing process. In this study, images have a dynamic range of 256 gray levels, the initial threshold is set to 2 and the number of increments is 127 in order to cover the complete dynamic range of the signals during the smoothing process. Two parameters are calculated from the Max-Min curve. The first one is defined as the slope parameter of the linear regression of the Max-Min curve. In order to minimize the effect of ROI orientation relative to the direction of ultrasound propagation, we applied the algorithm to the horizontal and the vertical directions of the ROI matrix. The average value which is determinated is taken as the slope value. The second parameter is called (Intercept). The intercept corresponds to the number of extrema on the un-smoothed signal.
Giat et al. [26] reported that the Max-Min parameters were used to process both the radio- frequency signal and its envelope. It is observed that, in both cases, the Max-Min parameters were independent of Gain, Time Gain Compensation (TGC), tissue attenuation and size of region of interest (ROI).
2.4.2. Second Order Statistical Parameters
2.4.2.1. Co-Occurrence Matrix (CM)
The co-occurrence matrix (CM) is a two-dimensional histogram. The CM is a symmetric matrix (N x N), where N is the greatest value of gray level existing in the image. The coefficient of the co-occurrence matrix calculated for one displacement vector (d, θ), represents the number of pixel-pairs which have the gray values of (i, j) and are separated by the distance (d: length in pixel number) and angle θ. Many CMs can be calculated for one image by changing the displacement vector (d, θ). It's important to note the optimal vector which gives the best representative CM. of echographic image texture. The displacement vector (1, 0°) for echography image has been determined by correlation parameter and χ2 method [27].
Fourteen parameters as described by haralick [25], which extracted from co-occurrence matrix.
That is, maximum of probabilities(Max_Prob), second moment angular (A.S.M), contrast(Contrast), correlation (Correlation), variance(VAR), inverse difference moment (IDM), sums average(SA), variance of sums(VS), variance of difference(VD), entropy (Entropy), entropy of sums(ES), entropy of difference(ED),coefficient of correlation-1(Correl-1) and coefficient of correlation-2(Correl-2) parameters are used for the texture analysis. The co-occurrence matrix and there parameters are used successfully in classification or segmentation in several domain, such as aerospace images, non-destructive testing (NDT) and in medical imaging.
2.4.2.2. Gray Level Run-Length Statistics
The run length matrix [RLM], described by Galloway [28] is a matrix with M x N dimension, where M is the number of gray level and N is the number of runs existing in an image. It is named iso-segment or iso-density matrix. A run is defined as the number of consecutive pixels, which have the same gray level in the direction θ, and is characterized by its length and gray level.
The element of the RL matrix gives the frequency of a run with gray level i and length j in the direction θ of the image. The RLMs are calculated in the four principal directions 0°, 45°, 90° and 135° to avoid a specific orientation of texture image.
Five parameters are extracted from one RLM. They are called short run-length emphasis [SRE], long run-length emphasis (LRE), gray level non uniformity (GLN), run-length non uniformity (RLN) and run percentage (RP) parameters [28]. Their definitions and characteristics can be found in the paper of Galloway [28]. All these parameters are calculated for each R.O.I. in the four angles 0°, 45°, 90° and 135° in order to obtain twenty texture parameters.
2.4.2.3. Statistical Analysis
The test of Mann and Whitney [29] which will be applied in this study is a suitable test with groups gathering a small number of samples. This nonparametric test, does not lay down any condition on the distribution (normal or not) of the data nor on the inter or intra variance group. In this case, the groups retained concerns posterior wall in systole and diastole phase, and (septal + lateral) wall in systole phase. For the purpose of this study, the parameter is significant for values less than or equal to 0.05 (5%). The discriminant parameters are expressed as mean±SD.
3. RESULTS/ DISCUSSION
3.1. Texture Calculations
In this study, it has been observed that the texture parameters extracted from gray level histogram in case of anterior, posterior, lateral and septal wall, do not disriminate between normal and contused myocardium.
In case of the anterior wall : the measurements of the short run-Lenght (SRE) in the horizontal direction were different between normal and contused myocardium (0.178 ± 0.021 versus 0.147 ± 0.020 respectively, p = 0.023, p < 0.05) at the end-diastolic.
In case of the posterior wall : the measurements of the variance (VAR) derived from the co-occurence matrix are different between normal and contused myocardium 4.66 ± 0.498 versus 2.482 ± 0.3339 respectively, p=0.023, p < 0.05] at the end-diastolic.
In case of the septal and the lateral wall, grouped on the same group, four texture features at the end-diastolic and two features at the end-systolic were different (p<0.05) between normal and contused myocardium as shown in Table 2.
Texture Measures that Distinguished Normal from Contused Myocardium [p<0.05]
| Septale + Lateral | Texture Measure | Mean ± SD Normal Contused | p |
|---|---|---|---|
| End-diastolic | Long-run H | 7.07±5.7 13.5±2.8 |
p< = 5% p = 0.05 |
| Run-percentage H | 0.119 ± 0.032 - 0.152 ± 0.045 |
P = 0.043 p<5% |
|
| Short-run 45° | 0.099 ± 0.11 - 0.57 ± 0.11 |
P = 0.034 p<5% |
|
| Run-percentage 45° | 0.211 ± 0.06 - 0.251 ± 0.07 |
p = 0.05 p<5% |
|
| Contrast* | 6.16 ± 2.66 - 9.18 ± 6.15 |
P = 0.034 p<5% |
|
| Variance of difference* | 4.19 ± 1.95 - 6.45 ± 4.63 |
P = 0.05 p<5% |
H = calculated in the horizontal direction,
* = derived from the co-occurence matrix.
3.2. Texture Aanalysis of TEE Images of Myocardial Contusion
This observation is different from that reported by Skorton et coll [11], where eleven texture parameters derived from the second order statistics to the diagnosis of myocardial contusion. This study was used in the closed chest dog, using transthoracic echocardiography, before and after experimental contusion. This experimental approach is different from the routine echocardiography. Obviousely, discriminant texture features obtained from transthoracic echocardiography are different than the texture parameters obtained from transesophageal echocardiography. Echo amplitudes are influenced by transducer center frequencies used for this study (2.4 Mhz for transthoracic and 5 Mhz for transesophageal) [12, 30]. Gray levels is affected by instrument setting such as adjustment parameters, preprocessing, postprocessing curves, and the compression function [27].
Skorton et coll found twelve texture features which are able to differentiate the normal from the contused myocardium [11]. Only one texture parameter was derived from the gray level histogram statistics (mean gray level). The others parameters were derived from the second order statistics.
In our study, none of the first order parameters was effective in differentiating normal and contused myocardium. Analysis of the gray level histogram (first order statistics) is an analysis of the overall distribution of echo amplitudes in an image, but cannot provide information on the spatial distribution of echo amplitudes. The number of discriminant parameters were limited and lacked the discriminating power.
It is observed that measurents of image gray level using second order statistics (Gray level run-lenght statistics and co-occurrence matrix), are capable to discriminate contused myocardium. It is also noted that the discrimaning texture parameters are different between regions of interest.
4. CONCLUSION
Quantitative texture analysis of the two-dimensional TEE image data represents a useful approach for ultrasound myocardial tissue characterization.
It is observed that regions of myocardial contusion exhibit visibly altered local echo- amplitude patterns (altered image texture) and that these image texture alterations may be quantified with digital image analysis techniques.
This preliminary result as shown in Table 2 and Fig. (1) demonstrate the feasibility of the proposed technique and discriminates between normal and contused myocardium.
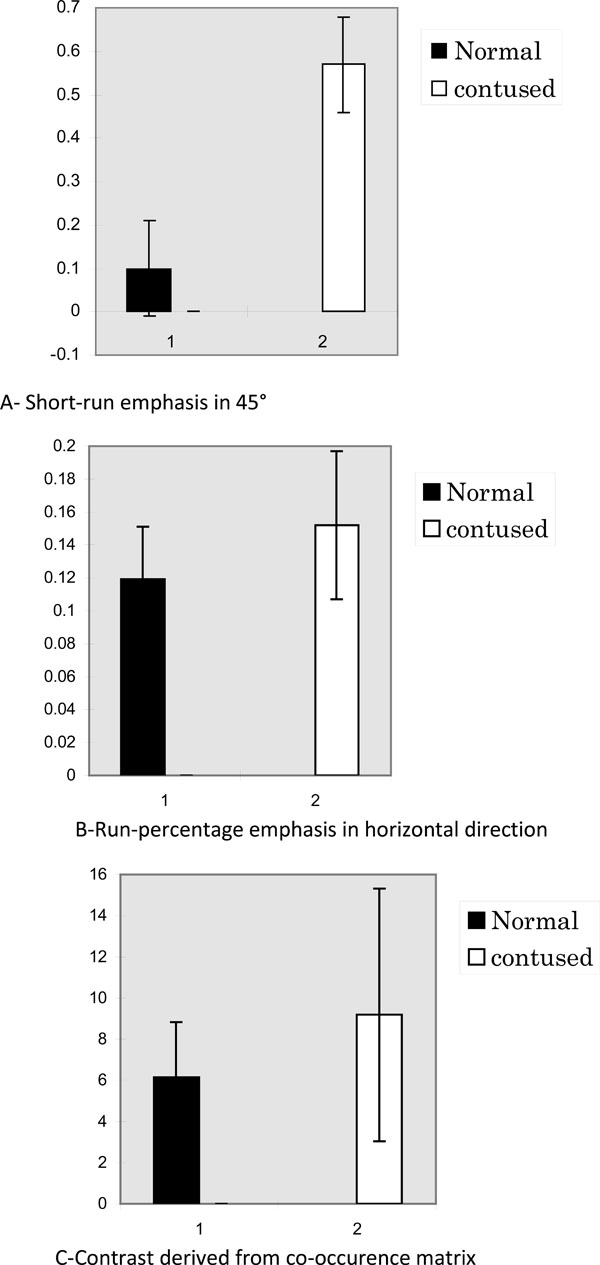 |
Fig. (1). The results of three representative calculations are presented for the septal and lateral wall. Values are mean ± SD. |
The study shows that texture measurent, is an invasive method, allowing independent operator and could be useful for a diagnosis aid of MC.
ACKNOWLEDGEMENTS
This work was achieved in collaboration with Henri Mendor Hospital*, Dr. N. liu service.
I would like to thank Dr. Ngai Liu, the head of the department and the personnel for their assistance during this study.