
RESEARCH ARTICLE
Cardiac Health Diagnosis Using Higher Order Spectra and Support Vector Machine
Chua Kuang Chua*, 1, Vinod Chandran2, Rajendra U Acharya1, Lim Choo Min1
Article Information
Identifiers and Pagination:
Year: 2009Volume: 3
First Page: 1
Last Page: 8
Publisher Id: TOMINFOJ-3-1
DOI: 10.2174/1874431100903010001
Article History:
Received Date: 20/11/2008Revision Received Date: 1/1/2009
Acceptance Date: 1/1/2009
Electronic publication date: 26/2/2009
Collection year: 2009
open-access license: This is an open access article licensed under the terms of the Creative Commons Attribution Non-Commercial License (http://creativecommons.org/licenses/by-nc/3.0/) which permits unrestricted, non-commercial use, distribution and reproduction in any medium, provided the work is properly cited.
Abstract
The Electrocardiogram (ECG) is an important bio-signal representing the sum total of millions of cardiac cell depolarization potentials. It contains important insight into the state of health and nature of the disease afflicting the heart. Heart rate variability (HRV) refers to the regulation of the sinoatrial node, the natural pacemaker of the heart by the sympathetic and parasympathetic branches of the autonomic nervous system. The HRV signal can be used as a base signal to observe the heart's functioning. These signals are non-linear and non-stationary in nature. So, higher order spectral (HOS) analysis, which is more suitable for non-linear systems and is robust to noise, was used. An automated intelligent system for the identification of cardiac health is very useful in healthcare technology. In this work, we have extracted seven features from the heart rate signals using HOS and fed them to a support vector machine (SVM) for classification.
Our performance evaluation protocol uses 330 subjects consisting of five different kinds of cardiac disease conditions. We demonstrate a sensitivity of 90% for the classifier with a specificity of 87.93%. Our system is ready to run on larger data sets.
1. INTRODUCTION
Electrocardiogram (ECG) is the P-QRS-T wave indicating the electrical activity of the heart. It originates at the sinoatrial (SA) node and the ECG signals are extracted by placing sensors at the limb extremities of the subject. The shape of the ECG signal indicates the cardiac health of the subject [1]. It is very difficult to decipher the subtle changes in these signals by our eye alone. These bio-signals are non-stationary and non-linear in nature.
Heart rate variability reflects the autonomic control of the cardiovascular system [2-3]. It is a simple, noninvasive technique which provides an indicator of the dynamic interaction and balance between the sympathetic nervous system and the parasympathetic nervous system. These signals are not linear in nature and hence, analysis using nonlinear methods can unveil the hidden information in the signal.
The HRV can be analyzed using (i) time domain analysis, (ii) frequency domain and (iii) non-linear methods. Time domain methods of HRV are simplest to use as they are based on common statistical measures. Time domain methods are the statistical methods and based on mean and standard deviation of the RR intervals [4].
A typical power spectrum of the heart rate signal has three main frequency regions [2]. The high frequency power (HF: 0.15-0.5 Hz) band reflects respiratory sinus arrhythmia (RSA) and cardiac vagal activity. Low frequency (LF: 0.04-0.15 Hz) power is related to baroreceptor control and is mediated by vagal and sympathetic systems. Very-low-frequency (VLF: 0.0033-0.04 Hz) power is related to the thermoregulatory, vascular mechanisms, and renin-angio tension systems.
Cardiac arrhythmia detection algorithms have been proposed using non-linear techniques [5-8]. Dingfie et al. have classified cardiac arrhythmia into six classes using autoregressive modeling [9].
The power spectrum provides the signal’s power (energy per unit time) falling within its frequency components [10-12]. But, it does not give any information about the phase relations between the frequency components. HOS can be used to analyze the nonlinear signals (VHF amplitudes), which may involve cross phase relations [13].
The Bispectrum is the Fourier Transform of the third order correlation of the signal which indicates cross correlation between frequency components in a two-dimensional (2-D) frequency plot [14-15]. It gives information about the phase coupling between the frequency components at f1, f2 , and f1 + f2 . The bicoherence is the normalized bispectrum.
Higher order spectra (HOS) are spectral representations of moments and cumulants and can be defined for deterministic signals and random processes. They have been used to detect deviations from Gaussianity and identify non-linear systems [14]. HOS based features can be formulated to be rotation, translation and scaling invariant when applied to one and two dimensional pattern recognition [16]. Research in the application of HOS includes detection of photomontage [17], mine detection [18], study of machine faults [19], recognition of viruses from electron microscopic images [20], analysis of biosignals like ECG [21] and EEG [22] etc.
The bicoherence approach was used to analyze the unexpected sudden very high frequency (VHF) peaks in the heart transplant subjects in [13]. They have indicated two types of peaks in this type of patients. The first type of VHF peaks reflects the cardiac-respiratory coupling, imposed by non-sinusoidal breathing. The second type was not induced by the respiratory system.
HOS have been widely used in the analysis of the EEG signals and recently, it has been applied to the HRV signal. The coupling between cardiac and respiratory activity was also studied using the bivariate data and cross-bispectrum computation between the ECG and respiratory signals [23]. They have absorbed the nonlinear coupling during both spontaneous and paced respiration. A technique for time-variant analysis of quadratic phase coupling (QPC) of the heart rate data was studied [24]. They have observed a phase co-ordination between the 10-second-rhythm and respiratory sinus arrhythmia (RSA) as well as a non-linear coupling (amplitude modulation) between these HRV components in neonatal heart rate signals.
Recently Chua et al., have analyzed the cardiac arrhythmia using heart rate signals using bispectrum invariant features and phase entropies [25]. They have proposed different bispectrum and bicoherence plots. In this paper, we derived features from the HOS and used them for classification. We were able to classify normal HRV signals and four other classes of arrhythmia with an average accuracy of above 85%.
The layout of the paper is as follows: Section (2) presents the data acquisition process and preprocessing of the raw cardiac signals. Section (3) deals with the HOS analysis namely the bispectrum, and the features of HOS, statistical analysis and SVM classifier used, Section (4) presents the results of the study. The discussion on our data analysis is presented in section (5). Finally the paper concludes in section (6).
2. DATA ACQUISITION PROCESS
The data used for analysis in this work was obtained by recording ECG signals (of 10 to 15 minutes duration) of over 330 patients in reclining condition. The permission from the clinicians and staff of the Kasturba Medical College Hospital, Manipal, India has been obtained to collect the data for this study. The original analog signal recorded in magnetic tapes (Holter recording) was subsequently converted to digital equivalent by discrete time sampling and quantization. A sampling rate of 320 samples/sec was chosen due to the fact that almost all the useful frequency components in the ECG signal were below 100 Hz. The numbers of dataset in each class is shown below in Table 1.
Numbers of ECG Data Sets for Different Cardiac Health States
| Class | NSR | PVC | CHB | SSS | CHF |
|---|---|---|---|---|---|
| Number of datasets | 183 | 37 | 42 | 43 | 25 |
For the purpose of this study, the cardiac data that include both the normal and other cardiac abnormalities are classified into five categories or classes, namely,
- Normal sinus Rhythm (NSR)
- Pre-ventricular Contraction (PVC)
- Complete Heart Block (CHB)
- Sick Sinus Syndrome (SSS)
- Congestive Heart Failure (CHF)
A brief description of the different cardiac classes is given below.
(i). Normal Sinus Rhythm (NSR):
A ‘P wave’ exists for every QRS complex. Each P wave is the same distance from the QRS complex – less than 20 seconds. All QRS complexes are the same size and shape and point in the same direction. Each QRS is the same distance from the T waves and the QRS the duration is 10 seconds or less. Heart rate will be varying in the range of 60-100 beats/minute and is rhythmic [1].
(ii). Preventricular Contraction (PVC):
These problems are formed outside the sino-atrial (SA) node. The QRS complex is widened and not associated with the preceding P wave. The T wave is inverted after PVC. It is often followed by a compensatory pause. In couplets, two consecutive PVCs exists [1].
(iii). Complete Heart Block (CHB) (Third Degree Heart Block):
This is a disease of the electrical system of the heart, in which the impulse generated in the SA node in the right atrium does not propagate to the ventricles. The ventricles contract and pump the blood at a slower rate. This results in the reduction of the heart rate (as low as 30 beats per minute).
(iv). Sick Sinus Syndrome III (Bradycardia – Tachycardia Syndrome):
is a group of diseases (symptoms) that indicate that the SA node is not functioning properly. It affects 3 out of every 10,000 subjects and becomes more common with age. The heart rate varies rhythmically in bradycardia (i.e. very slow) and tachycardia (i.e. very fast) patterns.
(v) . Congestive Heart Failure (CHF):
is a condition in which the weakened heart muscle is unable to pump enough oxygen-rich blood for the body. When the heart can not pump enough blood, fluid accumulates in the lungs and other organs. It is most common in elderly subjects above 70 years.
2.1. Preprocessing
The preprocessing of the ECG signals runs through the following steps.
- The data is passed through a low pass filter with a cut-off frequency of 35Hz to remove unwanted high frequencies present in the ECG signal.
- A high pass filter with cut-off frequency 0.3Hz is applied to suppress the baseline wander that is present in the signal.
- A band-stop filter of cut-off frequencies 50 or 60Hz is used to suppress the power-line interference noise.
- Finally a median filter is used to extract baseline wander of the processed ECG signal, and then it is subtracted from the processed ECG signal to effectively remove all the baseline wander.
In order to detect the R peaks of the ECG, Tompkins algorithm [26-27] is employed on the ECG data.
The interval between two successive QRS complexes is defined as the RR interval (tr-r seconds) and the heart rate (beats per minute) is given as:
 |
(1) |
3. METHODS USED
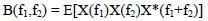
The HRV signal is analyzed using different higher order spectra (also known as polyspectra) that are spectral representations of higher order moments or cumulants of a signal. In particular, this paper studies features related to the third order statistics of the signal, namely the bispectrum. The Bispectrum is the Fourier Transform of the third order correlation of the signal and is given by
 |
(2) |
where X(f) is the Fourier transform of the signal x(nT) and E[.] stands for the expectation operation. In practice, the expectation operation is replaced by an estimate that is an average over an ensemble of realizations of a random signal. For deterministic signals, the relationship holds without an expectation operation with the third order correlation being a time-average. For deterministic sampled signals, X(f) is the discrete-time Fourier transform and in practice is computed as the discrete Fourier transform (DFT) at frequency samples using the FFT algorithm. The frequency f may be normalized by the Nyquist frequency to be between 0 and 1.
3.1. Higher Order Spectral Features
In our earlier study, we proposed the general patterns for different classes of arrhythmia. Bispectral entropies [25] were derived to characterize the regularity or irregularity of the HRV from bispectrum plots. The formulae for these bispectral entropies are as follows:
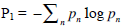
Normalized Bispectral Entropy (BE 1):
 |
(3) |
where 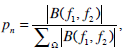 Ω = the region as in Fig. (1).
 |
Fig. (1). Non-redundant region of computation of the bispectrum for real signals. Features are calculated from this region. Frequencies are shown normalized by the Nyquist frequency. |
 |
(4) |
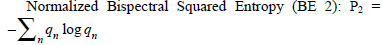
where 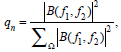 Ω = the region as in Fig. (1).
The normalization in the equations above ensures that entropy is calculated for a parameter that lies between 0 and 1 (as required of a probability) and hence the entropies (P1 and P2) computed are also between 0 and 1.
In this study we also make use of features related to moments [28] and the weighted centre of bispectrum (WCOB) [29] to characterize these plots. The features related the moments of the plot are:
The sum of logarithmic amplitudes of the bispectrum:
The sum of logarithmic amplitudes of diagonal elements in the bispectrum:
The first-order spectral moment of amplitudes of diagonal elements in the bispectrum:
These features (H1-H3) were used by Zhou et al. [28] to classify mental tasks from EEG signals.
The definition of WCOB [29] is given by:
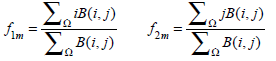
where i, j are the frequency bin index in the non-redundant region.
Blocks of 1024 samples, corresponding to 256 seconds at the re-sampled rate of 4 samples/sec were used for computing the bispectrum. These blocks were taken from each HRV data record with an overlap of 512 point (i.e. 50%).
3.2. Quantitative Analysis
ANOVA uses variances to decide whether the means are different. This test uses the variation (variance) within the groups and translates into variation (i.e. differences) between the groups, taking into account how many subjects there are in the groups. If the observed differences are high then it is considered to be statistically significant.
In this work, all the features described above were obtained and tested with ANOVA. The results of these were subjected to ‘t’ test with more than 95% confidence interval giving excellent ‘p’ values, far lower than 0.05, in all cases (Table 2).
Results of ANOVA on Various Bispectral Features. Entries in the Columns Other than the Last Correspond to Mean and Standard Deviation
| Features | Normal | PVC | CHB | SSS | CHF | P-Value |
|---|---|---|---|---|---|---|
| P1 | 0.719 ± 0.086 | 0.824 ± 0.063 | 0.710 ± 0.022 | 0.780 ± 0.091 | 0.605 ± 0.129 | <0.0001 |
| P2 | 0.430 ± 0.146 | 0.542 ± 0.181 | 0.428 ± 0.150 | 0.420 ± 0.255 | 0.187 ± 0.140 | <0.0001 |
| H1 | 2.81e5 ± 5.82e4 | 3.64e5 ± 4.55e4 | 1.79e5 ± 4.23e4 | 4.64e5 ± 3.40e4 | 2.02e5 ± 5.43e4 | <0.0001 |
| H2 | 1.29e3 ± 2.31e2 | 1.60e3 ± 1.74e2 | 8.94e2 ± 1.66e2 | 1.98e3 ± 1.22e2 | 9.74e2 ± 2.18e2 | <0.0001 |
| H3 | 1.42e5 ± 3.04e4 | 1.90e5 ± 2.39e4 | 8.94e4 ± 2.15e4 | 2.38e5 ± 1.87e4 | 1.02e5 ± 2.89e4 | <0.0001 |
| f1m | 60.00 ± 61.90 | 126.70 ± 43.10 | 41.95 ± 10.90 | 62.85 ± 36.80 | 33.71 ± 25.5 | <0.0001 |
| f2m | 22.32 ± 31.40 | 56.35 ± 36.80 | 12.91 ± 4.28 | 31.05 ± 23.2 | 10.50 ± 9.89 | <0.0001 |
3.3. Support Vector Machine (SVM) Classifier
In this study a kernel-based classifier is adopted for classification of the cardiac abnormalities. Herein, the attribute vector is mapped to some new space. Despite the fact that classification is accomplished in a higher dimension space, any dot product between vectors involved in the optimization process can be implicitly computed in the low dimensional space [30].
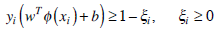
For a training set of instance-label pairs (xi , yi ), i = 0,…, l where xi ∈ Rn and yi = {-1, 1} and if ø(.) be a non-linear operator mapping the attribute vector x to a higher dimensional space, the optimization problem for the new points ø(x) becomes
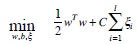
subject to the constraints
 |
(6) |
where C>0 is the penalty parameter for the error term and ξi are a set of slack variables that are introduced when the training data is not completely separable by a hyper plane. The SVM finds a linear separating hyper plane with the maximal margin in this higher dimensional space. As in the linear case, the mapping appears in terms of the kernel function K(xi , xj )= ø(xi)Tø(xj). Despite the fact there are several kernels, typical choice for kernels are radial basis functions. The RBF kernel non-linearly maps samples into a higher dimensional space. There are several methods that can be used to extend a binary class SVM to multi-class SVM. In this work, we used the One against all method SVM to classify the five classes of HRV data [31]. We perform an initial grid search to obtain a suitable regularization constant and it was set to 190 for our experiment [32].
3.4. Test Vector Generation
In order to measure and validate the performance of a classifier, there should be a sufficiently large set of the test data. When only a small database is available, different combinations of training and test sets can be used to generate more trials. In our experiment, we choose approximately two third of the data from each class of HRV signals for training and one third for testing. This experiment was repeated five times by choosing different combinations of training data and test data. Combinations of training and test data were randomly chosen. In each of these experiments, a new SVM model was generated and the test data sets did not overlap with the training data sets.
4. RESULTS
Table 2 shows the range of values for all the seven features for the five classes. The distribution of various features for the fives classes of arrhythmia are shown in Fig. (2a-g). The result of ANOVA with features obtained from HOS for various kinds of cardiac diseases is listed in Table 2.
 |
Fig. (2a-d). Distributions of various features extracted from the bispectrum (a) bispectrum entropy 1 (P1), (b) bispectrum entropy 2 (P2), (c) sum of the logarithmic amplitudes of the bispectrum (H1), (d) sum of logarithmic amplitudes of diagonal elements (H2). |
 |
Fig. (2e-g). Distributions of various features extracted from the bispectrum (e) first-order spectral moment of amplitudes of diagonal elements in the bispectrum (H3), (f) the weighted centre of bispectrum frequency index 1 (f1m), (g) the weighted centre of bispectrum frequency index 2 (f2m). |
For Normal cases, heart rate varied continuously between 60bpm-80 bpm. The bispectrum entropies (P1 and P2) appear to be high due to higher variation in the heart rate. The mean value of P1 is 0.719 while that of P2 is 0.43. The mean values of moments H1, H2, H3 are 2.81e5, 1.29e3 and 1.42e5 respectively. The WCOB mean values for f1m, f2m are 60 and 22.32 respectively. It may be that these values are related to the rate of breathing and its harmonics. And there may be a modulating effect on the heart rate variability due to the breathing pattern.
In the Pre-Ventricular Contraction, there will be ectopic beats in the normal ECG signals. The mean entropies (P1 and P2) indicated in the Table 2 are correspondingly higher than the normal case due to higher variation. The mean values of moments H1, H2, H3 are 2.81e5, 1.29e3 and 1.42e5 respectively. The WCOB mean values for f1m, f2m are 126.7 and 56.35 respectively.
In CompleteHeartBlock (CHB) the Atrio-ventricular node is unable to send electrical signals rhythmically to the ventricles and as a result the heart rate remains low. The bispectrum entropies (P1 and P2) indicated in the Table 2 are lower as compared to the normal subject due to the reduced beat to beat variation. The mean values of moments H1, H2, H3 are 1.79e5, 8.94e2 and 8.94e4 respectively. The WCOB mean values for f1m, f2m are 41.95 and 12.91 respectively.
In SSS -III there is a continuous variation of heart rate between Bradycardia and Tachycardia. The bispectrum entropies (P1 and P2) indicated in the Table 2 are comparable with the normal case due to the higher variation in the beat to beat. The mean values of moments H1, H2, H3 are 4.64e5, 1.93e3, 2.38e5 and 8.94e4 respectively. The WCOB mean values for f1m, f2m are 62.85 and 31.05 respectively.
In the case of Congestive Heart Failure (CHF) the heart is unable to pump the blood (supply enough oxygen) to the different parts of the body. The mean bispectrum entropies (P1 and P2) are lower than the normal case due to the reduced beat to beat variation. The mean values of moments H1, H2, H3 are 2.02e5, 9.74e2, 1.02e5 and 8.94e4 respectively. The WCOB mean values for f1m, f2m are 33.71 and 10.50 respectively.
Fig. (2a-d) indicates the distribution of P1, P2, H1 and H2 features. And the distribution of H3, f1m and f2m are shown in Fig. (2e-g). Table 3 shows the confusion matrix obtained by the SVM classifier. The result of classification efficiency is shown in Table 4. Our results show that, our proposed method can classify the unknown cardiac class with an efficiency of about 85%, sensitivity and specificity of 90% and 87.93% respectively (Table 5).
Confusion Matrix for Five Different Classes of Arrhythmia with a SVM Classifier
| Type | NSR | PVC | CHB | SSS | CHF |
|---|---|---|---|---|---|
| NSR | 255 | 17 | 13 | 0 | 5 |
| PVC | 12 | 37 | 0 | 1 | 0 |
| CHB | 5 | 0 | 48 | 0 | 7 |
| SSS | 0 | 1 | 0 | 64 | 0 |
| CHF | 4 | 0 | 0 | 0 | 31 |
Classification Accuracy for Five Different Classes of Arrhythmia with a SVM Classifier
| Class | NSR | PVC | CHB | SSS | CHF | Average |
|---|---|---|---|---|---|---|
| Accuracy (%) | 87.93 | 74.00 | 80.00 | 98.46 | 88.57 | 85.79 |
Sensitivity, Specificity, Positive Predictive Value for the SVM classifier. Entries to the Left are the Numbers of True and False Negatives and the True and False Positives
| TN | FN | TP | FP | Specificity | Sensitivity | +PV |
|---|---|---|---|---|---|---|
| 255 | 21 | 189 | 35 | 87.93% | 90.00% | 84.38% |
5. DISCUSSION
Different non-linear methods have been used to classify the cardiac classes using the heart rate signals [6, 33-34]. In all these studies, different non-linear parameters namely correlation dimension, Lyapunov exponent, approximate entropy, fractal dimension, Hurst exponent and detrended fluctuation analysis have been used to identify the unknown class of the disease.
In this work, we have applied higher order spectra as a non-linear tool to analyze cardiac signals. Table 5 shows the results of the application of HOS for cardiac signals. We have used the SVM and bispectral features to diagnose the different cardiac arrhythmia.
Bispectrum and bicoherence helps in the reduction of Gaussian noise reduction and detection of nonlinearities (phase coupling) in the signals [14, 35]. The real and spurious VHF (very high frequency) peaks were detected using bicoherence technique in about 50% of heart transplant(HT) subjects using the heart rate signals [13]. They have observed two types of peaks in HT subjects. First peak reflects the nonlinear response to the cardiovascular system to the respiration. Second peak indicates the nonlinear response to the nonrespiratory spectral component of unknown origin.
Different ranges of bispectrum entropies and bispectrum invariants have been proposed for different cardiac arrhythmia [25]. They have also proposed unique bispectrum and bicoherence plots for different cardiac diseases.
One of the major challenges in non-linear biosignal processing is the presence of intra-class variation. Another challenge is that there are overlaps among the derived features for various arrhythmias. Hence in our present work, we have used two bispectrum entropies and three features related to the moments and two weighted centre of bispectrum as descriptors to differentiate different arrhythmia. These features were then fed to the SVM classifier for automated classification. We achieve about 85% of classification accuracy with the current set of features. The accuracy may be further increased by extracting better features and taking more diverse training data.
A comparison with other related work of arrhythmia classification based of heart rate signals and features based on non-linear methods is shown in Table 6.
Comparison of Arrhythmia Classification with Non-Linear Features
| Authors | Method | No. of Class | Accuracy (%) |
|---|---|---|---|
| Acharya et al. (2003) | Non-linear features-ANN-Fuzzy | 4 | 95 |
| Acharya et al. (2004) | Non-linear --Fuzzy | 8 | 85.36 |
| Kannathal et al. (2006) | Anfis | 10 | 94.09 |
| Chua et al. (2007) | SVM | 5 | 85.79 |
| Acharya et al. (2008) | Modeling | 9 | 83.38 |
Acharya et al. pioneered the work on HRV classification using non-linear parameters such as spectral entropy, Poincare plot geometry and Largest Lyapunov exponent. In this initial attempt, they were able to achieve an average accuracy of 95% for four classes [36] and 85.36% for 8 classes [37]. Recently, Kanalthal et al. have [33] improved this work using adaptive neuro-fuzzy fuzzy inference system (ANFIS) classifier and they were able to achieve the efficacy to an average value of 94.09%. Recently, Acharya et al., have classified the cardiac states using using fast Fourier transform (FFT), auto regressive (AR), auto regressive moving average (ARMA) and moving average (MA) modeling techniques into 9 classes [38]. They have used first three peak amplitudes and corresponding peak frequencies as the features into the neural network classifier. And they were able to classify correctly up to 83.83% using ARMA modeling technique.
This is an initial work with HOS features and with further enhancement and more training data, it is possible that the efficacy could be further improved.
6. CONCLUSION
The Heart rate variability signal can be used as reliable indicator of some cardiac diseases. In this work, we have extracted different HOS features from heart rate signals for automated classification. We have evaluated the effectiveness of different bispectrum entropies, moments and weighted centre of bispectrum as features for the classification of various cardiac abnormalities. Our proposed system that utilizes a combination of the different features with a Support Vector Machine classifier is able to identify the unknown cardiac class with a sensitivity and specificity of 90% and 87.9% respectively. The accuracy of our proposed system depends on several factors, such as the size and quality of the training set, the rigor of the training imparted, and also the extracted HOS parameters.
REFERENCES
| [1] | Sokolow M, Mcllroy MB, Chiethin MD. Clinical cardiology In: VLANGE medical book. 1990. |
| [2] | Akselrod S, Gordon D, Ubel FA, Shannon DC, Berger AC, Cohen RJ. Power spectrum analysis of heart rate fluctuation: A quantitative probe of beat-to-beat cardiovascular control Science 1981; 213: 220-. |
| [3] | Kamath MV, Ghista DN, Fallen EL, Fitchett D, Miller D, McKelvie R. Heart rate variability power spectrogram as a potential noninvasive signature of cardiac regulatory system response, mechanisms, and disorders Heart Vessels 1987; 3: 33-41. |
| [4] | Task Force of the European Society of Cardiology and North American Society of Pacing and electrophysiology. Heart Rate Variability: Standards of measurement, physiological interpretation and clinical use Eur Heart J 1996; 17: 354-81. |
| [5] | Sun Y, Chan KL, Krishnan SM. Arrhythmia detection and recognition in ECG signals using nonlinear techniques Ann Biomed Eng 2000; 28(1): S-37. |
| [6] | Mohamed IO, Ahmed H, Abou-Zied Abou-Bakr M, Youssef YMK. Study of features on nonlinear dynamical modeling in ECG arrhythmia detection and classification IEEE Trans Biomed Eng 2000; 49(7): 733-6. |
| [7] | Acharya UR, Jasjit Suri, Jos AE Spaan, Krishnan SM. Advances in cardiac signal processing. Springer Verlang GmbH Berlin Heidelberg 2007. |
| [8] | Chua KC, Chandran V, Acharya UR, Lim CM. Computer- based analysis of cardiac state using entropies, recurrence plots and Poincare geometry J Med Eng Tech 2008; 32(4): 263-72. |
| [9] | Ge D, Srinivasan N, Krishnan SM. Cardiac arrhythmia classification using autoregressive modeling BioMed Eng Online 2002; 1: 5. Available from: http://www.biomedical-engineering-online.com/content/1/1/5 |
| [10] | Oppenheim AV, Schafer RW. Fourier analysis of signals using the discrete Fourier transform Discrete-Time Signal Analysis. New Jersey: Prentice-Hall 1989; pp. 695-767. |
| [11] | Marple SL. Digital spectral analysis with applications. Englewood Cliffs, New Jersey: Prentice-Hall 1987. |
| [12] | Kay SM. Modern spectral estimation: theory & application. New Jersey: Prentice-Hall 1988. |
| [13] | Pinhas I, Toledo E, Aravot D, Akselrod S. Bicoherence analysis of new cardiovascular spectral components observed in heart-transplant patients: statistical approach for bicoherence thresholding IEEE Trans Biomed Eng 2004; 51: 1774-83. |
| [14] | Nikias CL, Petropulu AP. Higher –order spectra analysis: A nonlinear signal processing framework. Englewood Cliffs, HJ, PTR: Prentice Hall 1993. |
| [15] | Elgar S, Guza RT. Statistics of bicoherence IEEE Trans Acoust Speech Signal Process 1988; 36: 1667-8. |
| [16] | Chandran V, Elgar S. Pattern recognition using invariants defined from higher order spectra-one-dimensional inputs IEEE Trans Signal Process 1993; 41(1): 205-12. |
| [17] | Ng TT, Chang SF, Sun Q. Blind detection of photomontage using higher order statistics In: Proc ISCAS. Canada: Vancouver 2004; 5: pp. (23-26)688-91. |
| [18] | Chandran V, Elgar S, Nguyen A. Detection of mines in acoustic images using higher order spectral features IEEE J Ocean Eng 2002; 27(3): 610-8. |
| [19] | Jang B, Shin C, Powers EJ, Grady WM. Machine fault detection using bicoherence spectra 3 In: Proceeding of Instrumentation and Measurement Technology Conference(IMTC); 2004; pp. : 1661-6. 18-20 |
| [20] | Ong H, Chandran V. Identification of gastroenteric viruses by electron microscopy using higher order spectral features J Clin Virol 2005; 34(3): 195-206. |
| [21] | Khadra L, Al-Fahoum AS, Binajjaj S. A quantitative analysis approach for cardiac arrhythmia classification using higher order spectral techniques IEEE Trans Biomed Eng 2005; 52(11): 1840-5. |
| [22] | Muthuswamy J, Sherman DL, Thakor NV. Higher order spectral analysis of burst patterns in EEG IEEE Trans Biomed Eng 1999; 46(1): 92-101. |
| [23] | Jamsek J, Stefanovska A, McClintock PVE. Nonlinear cardio-respiratory interactions revealed by time-phase bispectral analysis Phys Med Biol 2004; 49: 4407-25. |
| [24] | Witte H, Putsche P, Eiselt M, Arnold M, Schmidt K. Technique for the quantification of transient quadratic phase couplings between heart rate components Biomed Tech (Berl) 2001; 46: 42-9. |
| [25] | Chua KC, Chandran V, Acharya UR, Lim CM. Cardiac state diagnosis using higher order spectra of heart rate variability J Med Eng Tech 2008; 32(2): 145-55. |
| [26] | Wariar R, Eswaran C. Integer coefficient bandpass filter for the simultaneous removal of baseline wander, 50 and 100 Hz interference from the ECG Med Bio Eng Comp 1991; 29(3): 333-6. |
| [27] | Jiapu P, Tompkins WJ. Real time QRS detector algorithm IEEE Trans Biomed Eng 1985; 32(3): 230-. |
| [28] | Zhuo SM, Gan JQ, Sepulveda F. Classifying mental tasks based on features of higher-order statistics from EEG signals in brain-computer interface Info Sci 2008; 178(6): 1629-40. |
| [29] | Zhang J, Zheng C, Jiang D, et al. Bispectrum analysis of focal ischemic cerebral EEG signal Proceedings of the 20th annual international conference of the IEEE Eng Med Bio Soc 1998; 20: 2023-6. |
| [30] | Vapnik V. Statistical learning theory. New York: Willey 1998. |
| [31] | Lingras P, Butz C. Rough set based 1-v-1 and 1-v-r approaches to support vector machine multi-classification Inf Sci 2007; 177(18): 3782-98. |
| [32] | Hsu CW, Chang CC, Lin CJ. A practical guide to support vector classification, Tech Rep, Dept of Comp Science, National Taiwan University 2003. |
| [33] | Radhakrishna RKA, Yergani VK, Dutt ND, Vedavathy TS. Characterizing chaos in heart rate variability time series of panic disorder patients Proc ICBME, Biovision 2001; 163-7. Bangalore, India 163-7 |
| [34] | Kannathal N, Lim CM, Acharya UR, Sadasivan PK. Cardiac state diagnosis using adaptive neuro-fuzzy technique Med Eng Phys 2006; 28(8): 809-15. |
| [35] | Zoubir AM, Iskander DR. Bootstrapping bispectra: An application to testing for departure from gaussianity of stationary signals IEEE Trans Signal Process 1999; 47: 880-4. |
| [36] | Acharya UR, Bhat PS, Iyengar SS, Rao A, Dua S. Classification of heart rate data using artificial neural networks and fuzzy equivalence relation J Pattern Recognit 2003; 36(1): 61-8. |
| [37] | Acharya UR, Kumar A, Bhat PS, et al. Classification of cardiac abnormalities using heart rate signals Med Bio Eng Comp 2004; 42(3): 288-93. |
| [38] | Acharya UR, Meena S, Nayak J, Xiang C, Tamura T. Automatic identification of cardiac health using modeling techniques: A comparative study Inf Sci 2008; 178(33): 4571-82. |