RESEARCH ARTICLE
Finger Motion Classification by Forearm Skin Surface Vibration Signals
Wenwei Yu*, 1, Toshiharu Kishi#, 1, U. Rajendra Acharya2, Yuse Horiuchi1, Jose Gonzalez1
Article Information
Identifiers and Pagination:
Year: 2010Volume: 4
First Page: 31
Last Page: 40
Publisher Id: TOMINFOJ-4-31
DOI: 10.2174/1874431101004020031
Article History:
Received Date: 8/10/2009Revision Received Date: 25/11/2009
Acceptance Date: 25/11/2009
Electronic publication date: 28/5/2010
Collection year: 2010
open-access license: This is an open access article licensed under the terms of the Creative Commons Attribution Non-Commercial License (http://creativecommons.org/licenses/by-nc/3.0/) which permits unrestricted, non-commercial use, distribution and reproduction in any medium, provided the work is properly cited.
Abstract
The development of prosthetic hand systems with both decoration and motion functionality for hand amputees has attracted wide research interests. Motion-related myoelectric potentials measured from the surface of upper part of forearms were mostly employed to construct the interface between amputees and prosthesis.
However, finger motions, which play a major role in dexterous hand activities, could not be recognized from surface EMG (Electromyogram) signals.
The basic idea of this study is to use motion-related surface vibration, to detect independent finger motions without using EMG signals. In this research, accelerometers were used in a finger tapping experiment to collect the finger motion related mechanical vibration patterns. Since the basic properties of the signals are unknown, a norm based, a correlation coefficient based, and a power spectrum based method were applied to the signals for feature extraction. The extracted features were then fed to back-propagation neural networks to classify for different finger motions.
The results showed that, the finger motion identification is possible by using the neural networks to recognize vibration patterns.
1. INTRODUCTION
It is no exaggeration to say that an upper limb without a hand has barely any function.
Recently, the development of prosthetic hand systems has attracted wide research interests. In order to construct the interface between amputees and prostheses, motion-related myoelectric potentials measured from the surface of upper part of forearms were mostly employed, to detect amputees’ motion intention, thus, to drive a robotic hand.
It has been reported that by 2-3 channels of surface EMG (Electromyogram) signals from forearm, up to 10 hand and wrist motions can be recognized [1, 2], also the on-line learning method proposed could cope with the time-varying motion-related EMG signals. Yoshikawa et al. [3] reported that, by using feature vectors in the time and frequency domain, a support-vector machine could be built to recognize 8 hand and wrist motions from forearm EMG signals. Chu et al. [4] extracted feature vectors from wavelet transformation of 4 channels of forearm EMG signals, and classified the feature vectors to 8 forearm motions classes using PCA (principal component analysis) and self-organization.
While most studies focus on wrist motions, there are few studies focusing on finger motions, which play a major role in dexterous hand activities, such as precision grasp of small objects. It has been reported that finger flexion angles could be estimated from 2 channels of surface EMG signals detected from the sites close to wrist, by using a neural network [5, 6]. However, it is difficult to apply their approach to high-level forearm amputees. It has been reported that, finger motion intention can be detected from 16 channels of forearm surface EMG signals, by using ICA (Independent Component Analysis)[7]. Apparently, due to the large number of sensors, the approach is not suitable for real prosthetic uses. And an estimate of low-level contraction of fingers was reported [8].
The difficulties to recognize finger motions from forearm surface EMG signals come from the following issues:
- The EMG signals detected from skin surface are the superposition of multiple muscle potentials;
- The electric potentials of activated muscles, especially, those deep-layered muscles, such as extensor indicis, are affected (attenuated and modulated) by various nonlinear elements, such as fat and tissue, before they are summed with other potentials;
- The finger motions are generally fast, with small range of motion, thus the amplitude of finger-motion-related surface myoelectric potentials is minute and of low S/N ratio.
On the other hand, since the hand and forearm motion related muscles and skeletons are arranged in a very tightly coupled way [9], the activation of one muscle will cause relative muscles’ concomitant movements, which do not result in any additional electric potentials, but indeed produce the mechanical vibration. The concomitant moments thus transfer the mechanical potentials of the voluntary motion of one finger to skin surface. We considered that, the mechanical vibration detected from skin surface is possibly contributive to finger motion detection. Since the robot hands with large degree of freedom (D.O.F) of controllable finger joints have been developed with the progress of robotics technology, if the intention of finger motions could be recognized from forearm surface EMG signals, the function of prosthetic hand could be greatly extended.
The goal of this research is the identification of finger motion by forearm bio-signals. Accelerometers were employed to detect the finger motion related mechanical vibration from skin surface, and a finger tapping experiment was conducted to collect the vibration patterns. In our previous work, the identification was realized by a template matching [10]. For one arm posture, a high correct rate was achieved, though, considering the use in real daily life, the recognition should be done at different arm postures, from the signals contaminated by different kind of noise sources, which will need a large number of templates for matching, thus making recognition impractically time consuming.
Thus in this study, two research efforts were made. 1) Since the basic properties of the finger motion related forearm skin surface vibration signals are unknown, and have not been studied till now, we explored the signal properties through comparing a norm based, a correlation coefficient based, and a power spectrum based feature extraction methods, aiming at extracting the amplitude, phase and frequency aspect of information from raw signals. 2) The back-propagation neural networks was employed with nonlinear transfer function and multiple patterns after training. The networks with different middle layer neuron number would be explored to find right scale of the classification.
The data set collected in the tapping experiment were processed with the feature extraction methods mentioned before, then separated into a training data set and a test data set, by which neural networks were trained, and tested, respectively. Making use of the recognition results, the properties of the finger motion related forearm skin surface vibration signals were discussed, and some ideas to construct an ideal recognition system were presented.
2. METHODS AND MATERIALS
2.1. Experiments
Six healthy male adult subjects (age: 23.17±1.33), called subject A-F, participated in the experiments. All of them are right-handed.
Three tri-axial accelerometers MMA7260Q (Freescale Semiconductor, Inc.) were used for recording the finger motion related skin surface vibration signals. The sensibility was set to 1.5G. Each sensor was mounted on a sensor board (AS-3ACC: Asakusa Giken) As shown in Fig. (1), one sensor was put on the surface of forearm flexor side (Sensor 1), and another two were put on the extensor side (Sensor2, and 3), with both sensors’ Z axis perpendicular to the skin surface. The sensor positions were determined empirically, and verified by preliminary experiment. For subject A-E, all the sensors were attached to their right forearm, however, since subject F was suffering from tenosynovitis on his right hand during the experiment time, the sensors were attached to his left forearm. Data sampling and data recording are based on Labview (National Instrument Corp.). The A/D sampling rate was set to 1600Hz.
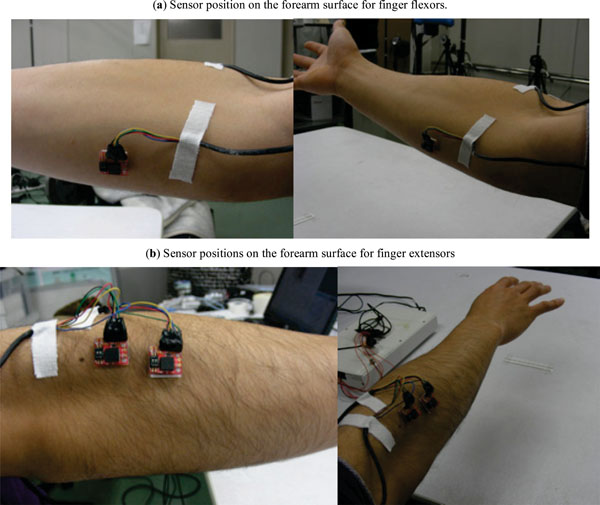 |
Fig. (1). Accelerometers for finger-motion related forearm vibration patterns. |
Subjects were asked to raise arms to the level of shoulder, parallel to horizontal plane, with their hands on one of the 3 postures, i.e., hand palms facing down, facing towards body side, facing up postures (see Fig. 2). For each posture, the subjects were required to tap each of 3 fingers (index, middle, ring finger) five times continuously, then to tap fingers designated by an instruction sequence, which include totally 15 finger motions, with each finger appearing 5 times, but at a randomized order. Between two experiments for different two postures, there was a 10-minute rest. For all 3 postures, altogether 90 finger-tapping signals were collected for each subject, which forms one set for the subject. The continuous and random tapping experiment was repeated once again, so as to collect another set of data. These two data sets were used as training data for the neural networks. The experiment was carried on for collecting another data set, which was used as test data for the neural networks.
 |
Fig. (2). Postures of finger tapping. |
Since accelerometers not only detect the finger-motion related skin surface vibration, but also the other body motion. In daily living, the system should be able to discriminate the finger motions from the other body motions. For each subject, signals were also recorded when his body was tapped or scratched, and when he moved the arm that was being measured. This was called as Noise data set, which contains 60 records, and two sets were collected. Fig. (3) shows one noise data example. The first 10 records are the signals when subject moved his arm, and the other records are the signals when his arm, body were tapped or scratched.
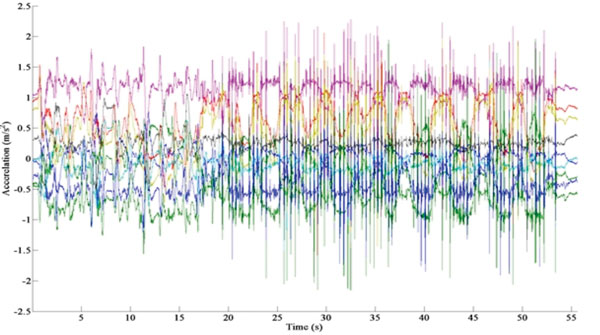 |
Fig. (3). An example of noise data. |
2.2. Feature Extraction
As depicted before, since the basic properties of the finger motion related forearm skin surface vibration signals are unknown, it is necessary to explore what kind of information is dominant, and significant to the finger motion identification. Because, amplitude, phase and frequency are basic properties of most biomedical signals, a norm based, a correlation coefficient based, and a power spectrum based feature extraction methods were employed.
2.2.1. Amplitude-Based Feature Extraction
For each axis of the tri-axial accelerometer, the value was unbiased, then used to calculate a second order norm to represent the amplitude feature. For 3 tri-axial accelerometers, the feature vector would contain 9 elements.
2.2.2. Phase-Based Feature Extraction
The signals of all the axes were unbiased, and standardized with the norm of the channel, then correlation coefficients for each two channels were calculated to form a feature vector. By this way, the phase information contained in all recordings could be extracted. Since 3 tri-axial accelerometers were used, each feature vector contains 9C2=36 elements.
2.2.3. Frequency Domain Feature Extraction
The signals of all the axes were unbiased, and passed to a 40Hz low-pass filter. The unbiased and filtered signals were then processed by Fourier transformation. From 4-40Hz, for each 4 Hz, one power spectrum point was extracted as one element of feature vector, so the feature vector contains 9(points)×9(axis)=81 elements.
2.3. Classification
In this research, a 3-layer neural network model was employed. A logistic sigmoid function was employed as the squashing function of its middle layer (eq. 1), where, sj is the state of the jth middle layer neuron, and hj is the output of middle layer neurons. In the output layer, a softmax function was employed (eq. 2), where yi is the state of the kth output layer neuron, zk is the output of the kth output layer neuron, and K is the output layer neuron number.
Due to the softmax function employed, the sum of the output layer is 1.0, thus, the output of network can be taken as the posterior probability of a certain input [11, 12]. That is, the output with a bigger entropy value can be taken as the one with large uncertainty, thus the one that should be rejected.
 |
(1) |
 |
(2) |
The error function was defined as the cross entropy, which is shown in equation (3), where, tpk means the kth element of the pth output pattern t, N is the total number of weights in the network, wn means the nth weight. The second item of equation (3) is called weight decay, which is introduced to avoid the over-learning problem, and improve the generalization ability of the network to the unknown patterns. α is a constant for controlling the network complexity. A bigger α means the more limited network complexity [12].
 |
(3) |
The networks were implemented in Matlab, and learning and recognition were done in an offline manner.
Since there does not exist a general way to decide the middle layer number, in this research it is explored by trial and error. The middle layer neuron number explored for different feature vector is shown in Table 1.
The Parameters for Different Neural Network
| Norm Vector | Correlation Coefficients | Power Spectrum | |
|---|---|---|---|
| Input Neuron Num | 9 | 36 | 81 |
| Middle Neuron Num | M1: 18; M2: 9; M3: 5 | M1: 29; M2: 18; M3: 11 | M1: 65; M2: 41; M3: 24 |
| Output Neuron Num | 3 | ||
| Learning Trial | 1000 | ||
| Learning Coefficient | 0.01 | ||
The Principal Feature for Each Finger, Each Subject
 |
Moreover, since the converged weights of neural network could be dependent on the initial weights. In this research, for each neural network structure, the initialization with randomized initial weights, training and testing would be repeated for 10 times.
3. RESULTS
3.1. Training and Testing without Noise Data Set
Fig. (4) shows the tested results of the networks learned from data sets with different feature vectors. Fig. (4a-d) shows neural network output, information entropy of the output, difference between the output and ideal values and recognized results, respectively. In the figure, horizontal axis stands for sample ID. 1-30 samples were recorded at the first posture, 31-60, 61-90 samples were recorded at the second and the third postures, respectively. The threshold of information entropy to judge the effective recognition is set to the 0.6 times of max entropy value, in this case, log23.
Fig. (5) shows the average and standard deviation of classification rates (correct rate) of 10 repeats of weight initialization, training, testing for each neural network structure. The symbols under the horizontal axis, I, M, R, mean index finger, middle finger and ring finger, respectively. “All” means the total recognition rate for all the 3 fingers. “Incorrect” means the miss-recognized sample percentage, and “Reject” means percentage of the output rejected by the information entropy threshold. The blue, red and green bars denote the middle layer neuron number for different input feature vectors, M1, M2, M3, as shown in Table 1, respectively.
In order to investigate the relationship between different feature vectors and recognition rates, the test results for all the subjects were summed up, and analyzed as a whole. The results were shown in Fig. (6), in which, the symbols under horizontal axis stand for the feature vectors input to the neuron networks (Norm: norm based feature vector, C.C.: correlation coefficient based feature vector, P.S.: power spectrum based feature vector). The blue, red, green bars denote the different middle layer neuron number, M1, M2, M3, as shown in Table 1, respectively.
 |
Fig. (4). Neural network output using correlation coefficient-based feature (subject A). |
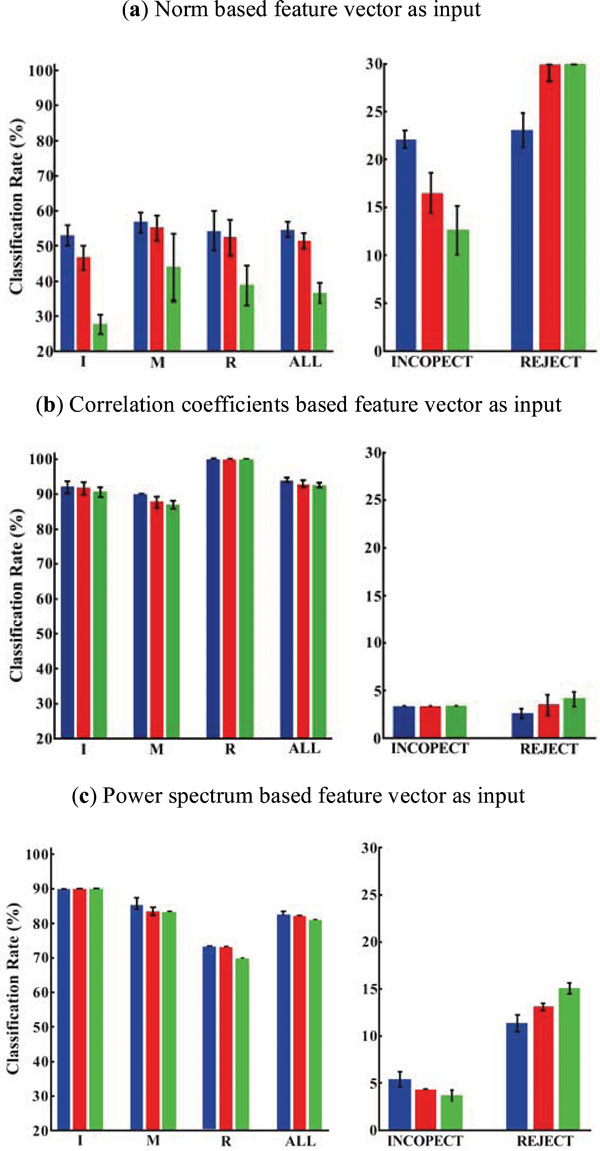 |
Fig. (5). The results of different neural networks to test data set (subject A). |
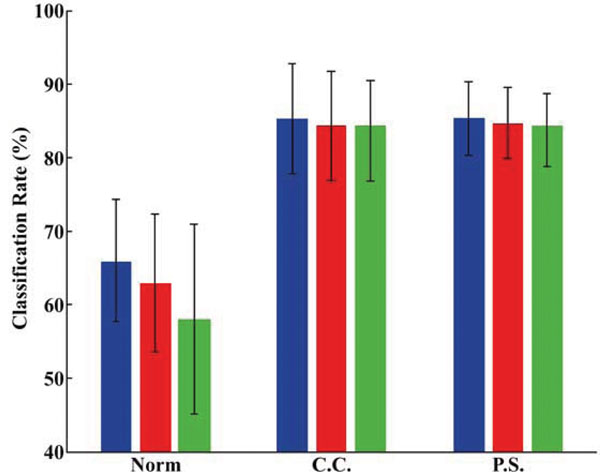 |
Fig. (6). Recognition correct rate of different networks and different input. |
As the middle layer neuron number decreases from M1 to M2, then to M3, there was few change in the classification rates of all neural networks trained by 3 different feature inputs. That is, the middle layer neuron number has a small influence on the recognition, which implied that, it is possible to construct a small neural network for the real-time recognition. Moreover, the fact that the standard deviation is small suggested that, the classification could be achieved independent on the initial weight values. It is apparent that, the correlation coefficient and power spectrum based feature vectors could give better classification than norm based feature vectors.
3.2. Training and Testing with Noise Data Set
The noise data sampled were added to the training and test sets. Correspondingly, one additional neuron was added to output layer for noise class. Meanwhile, the threshold of information entropy to judge the rejection of unclear output is set to log24×0.6. Fig. (7) shows the classification results of subject A. As shown in the figure, the network trained by norm based input vector showed worse performance. Its classification rate was low, while the reject rate was high.
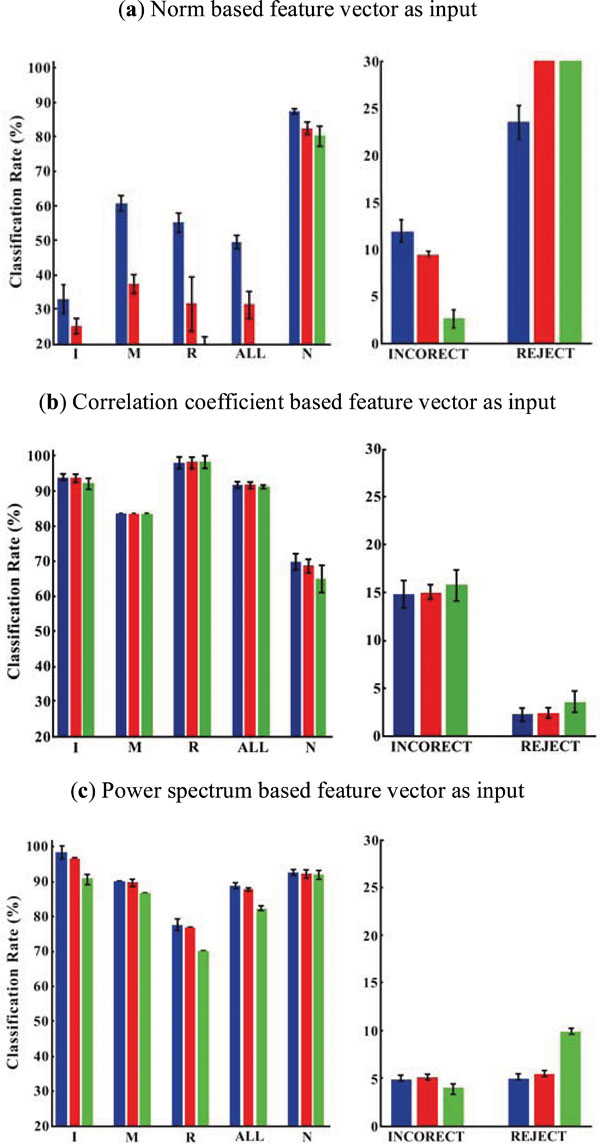 |
Fig. (7). The results of different neural networks to test data set (subject A) (“with noise” case). |
This could be further made clear by analyzing the test results of all the subjects as a whole, which is shown in Fig. (8), in which, the symbols under horizontal axis stand for the feature vectors input to the neuron networks (Norm: norm based feature vector, C.C.: correlation coefficient norm based feature vector, P.S.: power spectrum norm based feature vector). The blue, red, green bars denote the different middle layer neuron number, M1, M2, M3 respectively as shown in Table 1. The classification rate of Norm based feature vector was quite low compared with that of C.C, and P.S.
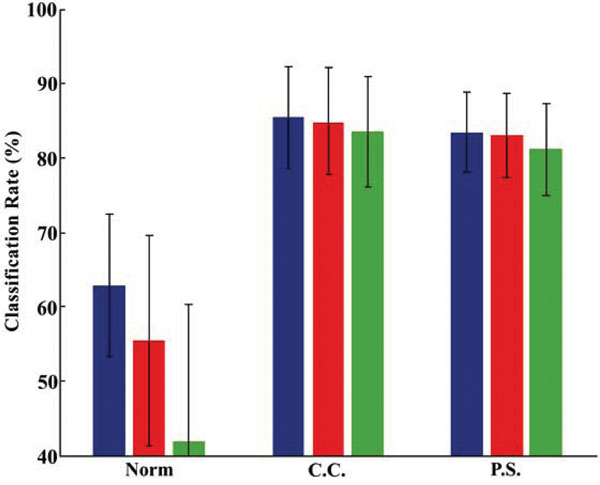 |
Fig. (8). Recognition rate of different networks and different input (“with noise” case). |
3.3. Real-Time Recognition
Based on the off-line analysis before a real-time recognition system was constructed, and a real-time finger-tapping test was carried out. Subject A took part in the experiment. Correlation coefficient based feature vector was used as the input. Middle layer of neuron network contains 11 neurons. 4 output neurons, corresponding to index, middle, ring fingers, and noise, were used. The neural network for real-time recognition was implemented in Labview (National Instrument), by copying the structure and learned weight values from the trained neural network in Matlab. In real-time finger tapping test experiment, the subject was asked to tap each finger 5 times continuously, then 15 times for 3 fingers in a randomized order. Additionally, 60 noise samples were also generated by scratching, tapping, vibrating the subject’s arm in action (Fig. 9a), and tested with the neural network. The recognition results were shown in Fig. (9b). The overall classification rate was over 85%.
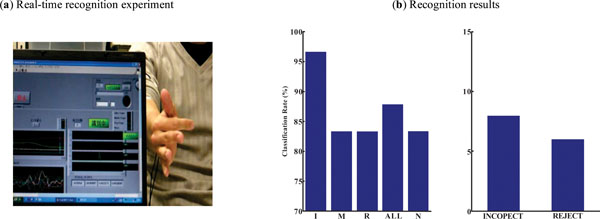 |
Fig. (9). Real-time recognition experiment and its results. |
4. DISCUSSION
4.1. The Features of the Finger Motion Related Forearm Skin Surface Vibration Signals
One major objective of this research is to investigate the basic feature of the signals. Our basic assumption is that given suitable input vectors, a neural network can give a reliable classification. And also, the feature that deliver higher classification rates will be the one that reflect the basic feature of the signals. Under this assumption, 3 feature extraction methods were tested. Fig. (6, without noise case), Fig. (8, with noise case) roughly showed that, correlation coefficient based and power spectrum based features were much better than the norm based feature.
Since from Figs. (6, 8), there is no clear difference between the correlation coefficient based and power spectrum based feature vectors, the comparison between these two features was made for each subject. For each feature extraction, for each subject, the 30 test results from 3 different neuron networks with 3 different middle layer neuron numbers were summed up, and their average and standard deviation were calculated and plotted in Fig. (10). Blue bar stands for correlation coefficient based feature, and red bar stands for the power spectrum based feature. A t-test was carried out to investigate the significant difference between these two feature extraction methods. The t-test showed that, for subject A, B, F, correlation coefficient based feature was better; while for subject E, F, the power spectrum based feature was more effective. From the current results, it is difficult to say, which one is more dominant. That is to say, the recognition of finger motions could benefit from both the frequency and phase information.
Furthermore, principal features for recognizing each finger for each subject, the average and standard deviation of difference between their classification rates, were listed in Table 2. The way to process data was similar as that of Fig. (10), except that, the feature resulting in better classification rate was defined as the principal feature, and listed (C.C.: correlation coefficent based feature, P.S.: power spectrum based feature).
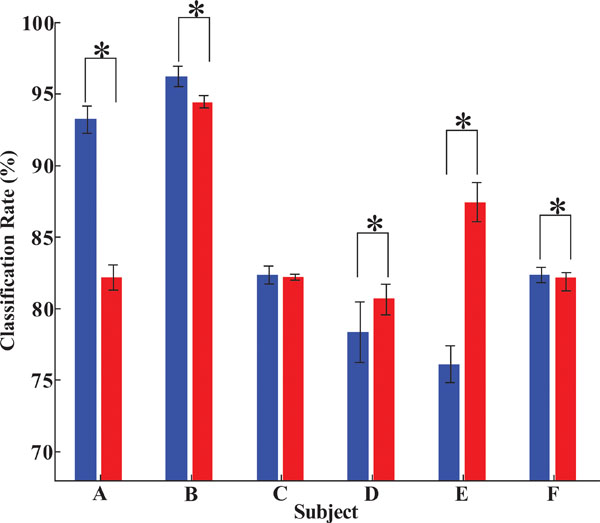 |
Fig. (10). Comparing correlation coefficient based and power spectrum based features for each subject (Blue: correlation coefficient based feature, Red: power spectrum based feature). |
As shown in the table, except subject A (C.C. for all fingers), the principal features for the other subjects are not identical. For subject E, P.S. apparently outperformed C.C. For the subject B, C, since the difference of classification rate is not too big, it would be acceptable to use C.C. as the feature for all the fingers. However, for subject D, F, since there exist clearly different features for different finger ( e.g., for subject D, P.S. outperformed C.C. by 32.22%, with a standard deviation of 2.02 for index finger, but for the same subject, C.C. outperformed P.S. by 21.67%, with a standard deviation 4.44 for middle finger). That is to say, even for a specific individual subject, for his different fingers, different features should be used for recognition.
Aiming at exploration of basic features of the signals as well, the feature extraction we used focused on completely different aspects from the signals: norm based feature for amplitude aspect, correlation coefficient based feature for phase aspect, power spectrum based feature for frequency aspect. That is, C.C. feature vector doesn’t contain the amplitude information, whereas, P.P. feature vector doesn’t contain phase information. However, for different fingers of different subjects, the specific information does have an important role in differentiating the finger from the others. From this discussion, it is clear that, the feature that can reflect phase and frequency information from raw signals is necessary.
4.2. The Effect of Noise Data Set on the Recognition
Furthermore, a comparison between the “with noise” case and “without noise” case was made and shown in Fig. (11). Again, the classification results of all the subjects were summed up, and analyzed as a whole. A t-test was carried out to investigate whether there is significant difference between “without noise” (blue bar) case and “with noise” case (red bar). Fig. (11) reflects that, the noise affected the recognition of almost all the networks significantly independent of the middle layer neuron number. The network trained by norm input vector was even more affected, however the network trained by the other two methods could maintain high classification rate.
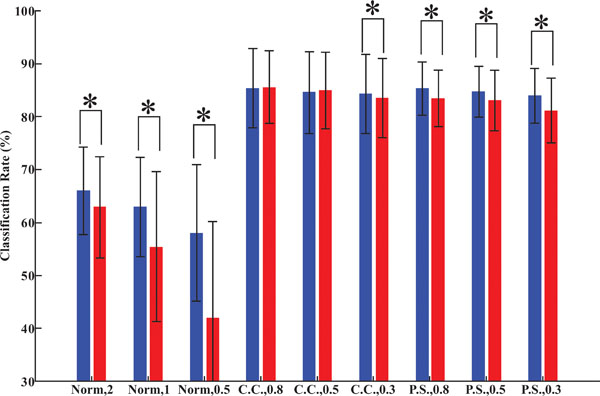 |
Fig. (11). The effect of noise data set (comparing different middle layer neuron number). |
In order to make sure the effect of the noise data set, the comparison was made again for each subject. Fig. (12) shows the comparison. The blue bar, red bar stands for the “without noise” case and “with noise” case, respectively. The results from the different middle layer neuron number trial were counted into each subject’s results. Fig. (12a) shows the difference in the term of correlation coefficients based feature vector, and Fig. (12b) shows that of power spectrum. A t-test was carried out to investigate whether there is significant difference between “without noise”(blue bar) case and “with noise” case (red bar) for every subject. In the neural network trained by correlation coefficient based input vector, subject D, E, and in the neural network trained by power spectrum based input vector, subject A, C, D showed a higher recognition rates after the noise data set was added to the training set.
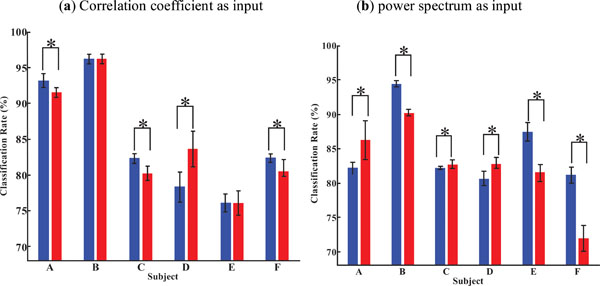 |
Fig. (12). Subject-dependent effect of noise data set. |
Two reasons can be considered: 1) by learning from the noise data, the boundary between different classes in solution space might be adjusted so as to classify some critical cases; 2) as the increment of output layer neuron number, the threshold of information entropy rose, in turn limited the miss-recognition. This can be revealed by Fig. (13), in which the information entropy of the output of “without noise” case (blue point), and “with noise” case (red point) of the neural network with the middle layer neuron number 29, trained by correlation coefficient based input, as well as their threshold values (blue line and red line respectively), were shown. The classification rate of the “with noise” case for all 3 fingers rose to 85.6% from the 80% of the “without noise case”.
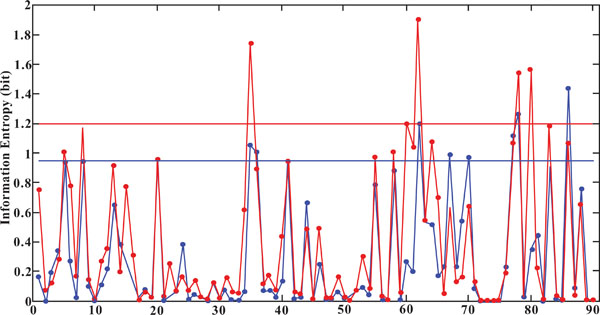 |
Fig. (13). Comparing information entropy of “without noise” case and “with noise” case (subject D). |
5. CONCLUSION
In this research, the skin surface mechanical vibration signals of finger tap motions were investigated. 3 Accelerometers, one for finger muscle flexor side, 2 for finger muscle extensor side were used to measure the vibration signals. 3 feature extraction methods were employed to capture the amplitude, phase and frequency aspect of the signals. Different feature vectors then were used to train back-propagation neural networks, which were then used as classifiers for different finger motions.
Through the finger motion classification results, it is clear that, the phase and frequency aspects should be considered for finger motion identification. Moreover, the addition of noise data set could sometimes improve the classification accuracy of neural networks.
Moreover, a real-time recognition experiment showed that, the finger motions can be identified from forearm surface vibration signals within 100ms, which is tolerable for a real-time device.
In the future, new feature extraction, which can capture both the phase and frequency information of the signals, are to be explored. Moreover, hand amputees subjects are also to be investigated.
ACKNOWLEDGEMENT
This work was supported in part by the Ministry of Education, Science, Sports and Culture, Grant-in-Aid for Scientific Research (B), 2009, 19300199.


