RESEARCH ARTICLE
Discovering Differences in Acoustic Emission Between Healthy and Osteoarthritic Knees Using a Four-Phase Model of Sit-Stand-Sit Movements
Lik-Kwan Shark*, 1, Hongzhi Chen1, John Goodacre2
Article Information
Identifiers and Pagination:
Year: 2010Volume: 4
First Page: 116
Last Page: 125
Publisher Id: TOMINFOJ-4-116
DOI: 10.2174/1874431101004010116
Article History:
Received Date: 4/12/2009Revision Received Date: 2/3/2010
Acceptance Date: 5/3/2010
Electronic publication date: 27/7/2010
Collection year: 2010
open-access license: This is an open access article licensed under the terms of the Creative Commons Attribution Non-Commercial License (http://creativecommons.org/licenses/by-nc/3.0/) which permits unrestricted, non-commercial use, distribution and reproduction in any medium, provided the work is properly cited
Abstract
By performing repeated sit-stand-sit movements to create stress on knee joints, short transient bursts of high frequency acoustic emission (AE) released by the knee joints were acquired from two age matched groups consisting of healthy and osteoarthritic (OA) knees, and significant differences between these two groups were discovered from the signal analysis performed. The analysis is based on a four-phase model of sit-stand-sit movements and a two-feature descriptor of AE bursts. The four phases are derived from joint angle measurement during movement, and they consist of the ascending-acceleration and ascending-deceleration phases in the sit-to-stand movement, followed by the descending-acceleration and descending-deceleration phases in the stand-to-sit movement. The two features are extracted from AE measurement during movement, and they consist of the peak magnitude value and average signal level of each AE burst. The proposed analysis method is shown to provide a high sensitivity for differentiation of the two age matched healthy and OA groups, with the most significant difference found to come from the peak magnitude value in the ascending-deceleration phase, clear quantity and strength differences in the image based visual display of their AE feature profiles due to substantially more AE bursts from OA knee joints with higher peak magnitude values and higher average signal levels, and two well separated clusters in the space formed by the principal components. These results provide ample support for further development of AE as a novel tool to facilitate dynamic integrity assessment of knee joints in clinic and home settings.
1. INTRODUCTION
Chronic arthritis, such as osteoarthritis (OA) and rheumatoid arthritis (RA), is a common cause of morbidity and disability worldwide [1], and its prevalence is predicted to increase as a result of aging populations [2]. A potential method of addressing and reducing the impact of such conditions is to begin treatment in the early stages of disease [3]. The sensitivity of clinical diagnosis however, especially in the early phase of these pathologies can be low, being compounded when the site of pain, if any remains obscure. The utilisation of various imaging techniques, such as X-rays, magnetic resonance imaging (MRI), and ultrasound by the clinician is important to aid diagnosis [4-6].
However, none of the common imaging techniques possess all of the desirable qualities without significant limiting factors, and a fundamental weakness comes from assessment of a dynamic anatomical structure, such as knee joints, in a static mode. While it is important to perform image based static examination to provide a detailed visualisation of the anatomical site of interest, there is a need for functional assessment in order to understand the full process of injury and disease. Although dynamic MRI could be used for this purpose [7], it presents obstacles in terms of accessibility, costs and portability, for use in clinic and home settings. This has led to the work being carried out by the authors to investigate the potential of acoustic emission (AE) for assessing the dynamic integrity of joints [8, 9].
AE is a natural phenomenon that can be detected by attaching a piezoelectric transducer to the surface of a structure under loading, and waveform based AE analysis has been widely used in engineering for condition monitoring applications, such as material failures involving crack initiation and propagation, bearing defect associated with mechanical interaction, or wear involving processes of friction and lubrication [10-13]. By drawing parallels between these condition monitoring examples and joint integrity assessment, a joint acoustic analysis system (JAAS) and a standardised measurement protocol were developed to assess healthy and OA knees [8]. The former consists of integration of an AE acquisition system and an electronic angle measurement system to provide joint angle based AE, and the latter consists of sensing location, sensor attachment and repeated sit-stand-sit movements to create joint stress. Through a pilot study of two groups with one consisting of young healthy knees and the other one consisting of old OA knees, a significant difference in AE was found to exist between these two groups representing two ends of the joint condition scale. In particular, the number and strength of AE events were found to be considerable higher in the old OA group compared to the young healthy group, especially in the ascending phase of the sit-to-stand movement [8, 9]. In this paper, the authors report further work in AE signal analysis based on a four-phase model of the sit-stand-sit movement and a two-feature descriptor of AE signals to discover the differences in AE between healthy and OA knee joints in the same age group.
The rest of the paper is organised as follows. Section 2 describes acquisition of joint angle based AE, which includes JAAS with its setup, the movement protocol and participants. This is followed by the presentation of pre-processing and analysis of joint angle based AE in Section 3, which proposes a four-phase model for sit-stand-sit movements, and presents AE feature based statistical analysis using the proposed four-phase model to show the differences between healthy and OA knees in the same age group. Section 4 starts with an image based visual display of AE feature profiles as a visual aid for quick joint integrity assessment, and ends with principal component analysis (PCA) of the image based visual display to show the sensitivity of the proposed four-phase two-feature method for differentiation of the healthy and OA knee joints in the same age group. Finally, conclusions are provided in Section 5.
2. ACQUSITION OF JOINT ANGLE BASED AE
Acquisition of joint angle based AE from knees was done using JAAS [8] and the whole system of JAAS is an integration of an AE acquisition system from Physical Acoustics and an electronic angle measurement system from Biometrics. As shown in Fig. (1), AE is acquired using two wide band piezoelectric sensors (denoted by S1 and S2) with a frequency range of 50–200 kHz (model S9204) attached to two knee joints (inferior to the patella and anterior to the medial patella retinaculum) using two hypoallergenic medical adhesive patches. These two AE sensors are connected to a laptop computer running the AEWin software via two AE pre-amplifiers of 40 dB gain and an AE Acquisition Board with PCI connection. Also shown in Fig. (1) are two electro-goniometers (model SG-150) attached to the lateral aspect of each knee to provide joint angles, and they are connected to the AE Acquisition Board via an amplification unit. Both AE sensors and electro-goniometers are driven by the same start trigger sent from the AEWin software to enable synchronised data acquisition.
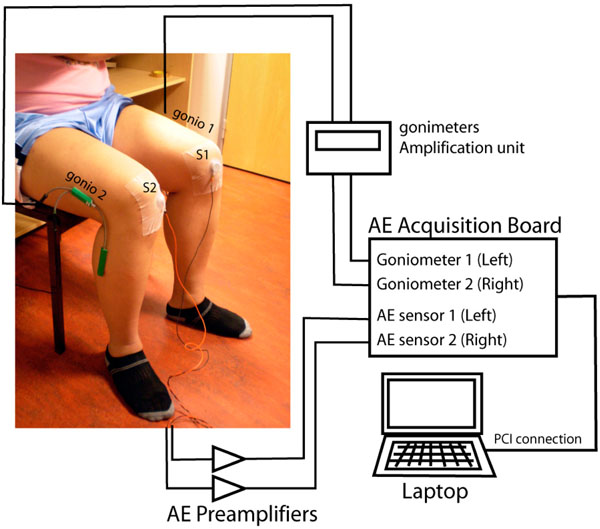 |
Fig. (1). JAAS and sensor attachment. |
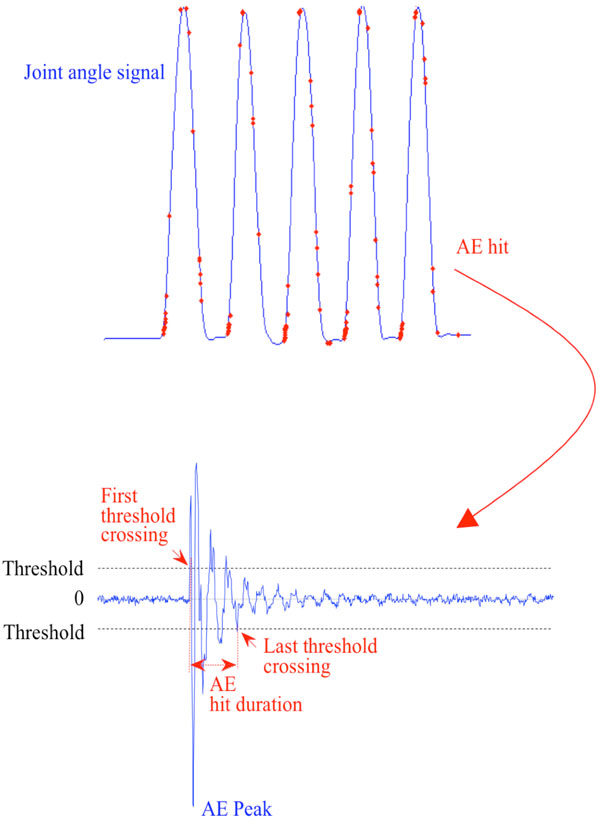 |
Fig. (2). (a) Joint angle based AE; and (b) AE waveform example. |
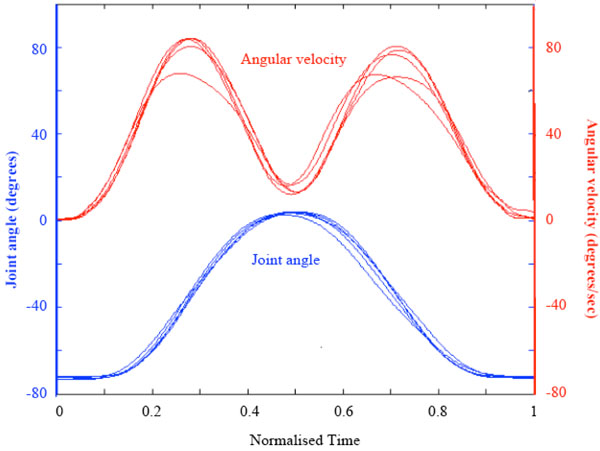 |
Fig. (3). Normalised joint angle and angular velocity during five repeated sit-stand-sit movements. |
 |
Fig. (4). Exponential probability plots of peak magnitude and ASL for (a) AA phase, (b) AD phase, (c) DA phase, and (d) DD phase. |
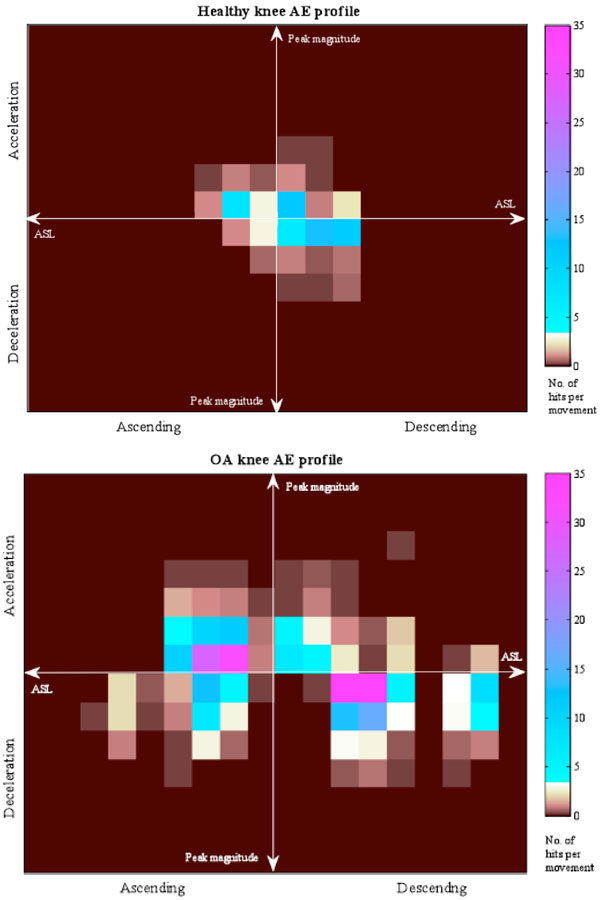 |
Fig. (5). Image based visual display for (a) a healthy knee AE profile, and (b) an OA knee AE profile. |
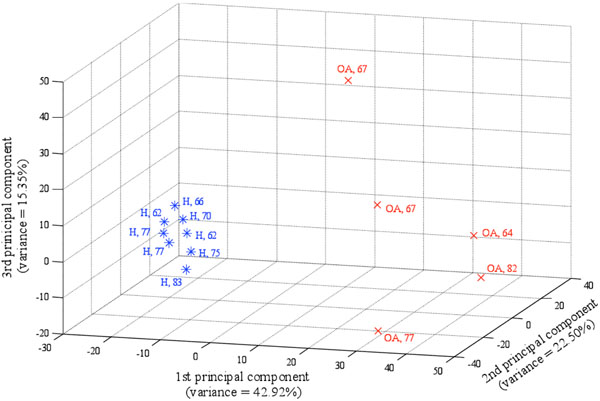 |
Fig. (6). PCA with healthy knees marked by * with H and age and OA knees marked by x with OA and age. |
Repeated sit-stand-sit movements to create joint stress are used as the movement protocol for acquisition of joint angle based AE [8, 9, 14]. Each sit-stand-sit movement consists of ascending from a standard height chair, with arms folded across the chest (in order to remove the influence of the movement strategy), reaching a fully erect standing position and then descending to return to a seated position. Movement was demonstrated to each participant, with each also being informed to move at a usual, comfortable speed. Furthermore, each participant was asked to perform a total of 10 sit-stand-sit movements, through series of 5 consecutive movements with a 30s to 1min break between each series.
Joint angle based AE was acquired from two age matched groups. While the group of healthy knees was recruited from the local population and consists of 8 people (2 females and 6 males) with mean age of 71.5 years (standard deviation of 7.73 years), the group of OA knees with radiological confirmation was recruited from patients referred for physiotherapy at the Blackpool, Fylde & Wyre NHS Foundation Trust and consists of 5 people (all male) with mean age of 71.4 years (standard deviation of 7.70 years). Health knees were defined as the absence of previous treatment for an injury to either knee and absence of regular pain, swelling or tenderness of the knee joints. Ethical approval was obtained from the NHS Local Research Ethics Committee. All participants were provided with an information sheet and written consent was obtained according to the Declaration of Helsinki.
With AE signals characterised by short duration bursts and AE data acquisition operated in a non-continuous recording mode to minimise data volume at 1MHz sampling frequency, a burst signal is recognised and recorded as an AE event or AE hit only if the waveform characteristics of the burst signal satisfying a set of hit definition parameters [15]. The settings of these hit definition parameters were based on observation and analysis of typical AE waveforms acquired in the previous study [8]. For the joint angle based AE data presented in this paper, the magnitude threshold to trigger AE recording was set to 32 dB (around 40 µV) in order for the acquisition system to be sufficiently sensitive to collect low magnitude AE signals observed at the initiation of joint movement. Furthermore, in order to provide adequate duration for detection of the highest peak in the waveform, the Peak Definition Time (PDT) that is retriggered upon encountering each higher signal magnitude after the first threshold crossing was set to 200 µs. In order to reduce the possibility of two separate AE hits being treated as one, the Hit Definition Time (HDT) that is retriggered upon encountering each threshold crossing with the signal magnitude falling below the threshold for determination of the end of the hit at the last threshold crossing was set 800µs and the Hit Lockout Time (HLT) that is activated by the end of HDT was set to 1,000 µs during which data acquisition is inhibited.
3. PRE-PROCESSING AND ANALYSIS OF JOINT ANGLE BASED AE
An example of joint angle based AE produced by JAAS for a set of five repeated sit-stand-sit movements is shown at the top of Fig. (2), where the solid curve shows the joint angle signal with the increase in the joint angle corresponding to the ascending phase and the decrease in the joint angle corresponding to the descending phase, and each dot superimposed on the joint angle signal corresponds to an AE event with its burst signal magnitude value above the defined threshold of 32dB. As an example, the AE waveform for one of the AE events is shown at the bottom of Fig. (2), where the AE peak is seen to correspond to the maximum magnitude in the AE hit duration defined by the first and the last threshold crossings.
With sit-stand-sit as the fundamental action in the movement protocol to create joint stress, each sit-stand-sit movement performed by a person can be considered as performing one individual test that gives a particular measurement outcome. With the action repeated several times, it is not unreasonable to assume some meaningful statistics to be contained in the multiple measurement outcomes generated by the repeated movement actions. This assumption leads to a pre-processing operation to isolate each sit-stand-sit movement by using the joint angle signal. If g(t) denote the joint angle signal, and ω(t) = dg(t)/dt denote the angular velocity, then the start and stop of each movement action can be identified by assigning a threshold value to |ω(t)|. In the implementation, the knee joint is assumed to be static when |ω(t)| < 0.1º/s and in motion when |ω(t)| > 0.1º/s.
For the same argument, each movement action can be divided further into its constituent phases for statistical analysis, such as the ascending phase (sit-to-stand) and the descending phase (stand-to-sit) based on the occurrence of the peak angle in order to group the AE measurement outcomes of each repeated tests under more compatible categories [8]. To link more closely with the underlying biomechanical strategies of knee joint movement including the temporal sequences of segment movement, muscle activity, and joint moments [16], each movement action is divided into four distinct phases based on the occurrence of the peak angle as well as the peak angular velocity for more meaningful statistical analysis. These four phases are
- the ascending-acceleration phase (AA) from the start of the movement at the sitting position to the occurrence of the peak angular velocity;
- the ascending-deceleration phase (AD) from the peak angular velocity in ascending to the occurrence of the peak angle upon reaching the standing position;
- the descending-acceleration phase (DA) from the occurrence of the peak angle to the occurrence of the peak angular velocity in descending; and
- the descending-deceleration phase (DD) from the peak angular velocity to the stop of the movement at the sitting position, respectively.
By extracting each joint angle variation cycle based on the start and stop of each movement cycle and normalising the time scale of each extracted joint angle variation cycle to one, Fig. (3) shows an example of five joint angle variation cycles superimposed on each other for a set of five repeated sit-stand-sit movements, and their corresponding angular velocity variations to provide a four-phase model of sit-stand-sit movements.
Using the four-phase model of sit-stand-sit movements, the statistical distributions of various AE waveform features in time and frequency domains were analysed to investigate the differences between healthy and OA knees. As shown in Fig. (4), two AE features were found to provide good discrimination. One is based on the AE peak magnitude value detected and the other is based on the average signal level (ASL) computed over the whole AE hit duration (see Fig. 2). The statistical distributions shown in Fig. (4) are four exponential probability plots of the AE peak magnitude and ASL values in dB to enable comparison of healthy and OA knees under four different phases of sit-stand-sit movements, and were generated from all the AE hits acquired from all 10 movements from all participants in both healthy and OA groups in order to represent a full set of data for characterisation of each group.
From Fig. (4), good similarities are seen to exist between the healthy and OA groups in all four different movement phases in terms of the curve shapes of the probability distributions generated based on either peak magnitude or ASL. However, the curve shapes of the peak magnitude based probability distributions differ from those of the ASL based probability distributions. The relatively straight curves formed by most of the peak magnitude values (more than 99%) for both healthy and OA groups in each movement phase are seen to imply the exponential probability distribution being a good model for peak magnitude. The same can not be said for ASL.
In terms of the lower and upper bounds of values occurring, both healthy and OA groups are seen to have the similar lower bound for each AE feature in all four different movement phases as shown in Fig. (4). These are 32 dB for peak magnitude due to the threshold setting, and 10 dB for ASL. However, there are significant differences in the upper bounds.
From the peak magnitude based probability distributions shown in Fig. (4), it is seen that
- the upper bounds of the OA group in all the movement phases are consistently higher than those of the healthy group;
- the lowest upper bound of the OA group occurs in the AA movement with a value just above 70 dB (see Fig. 4a);
- the highest upper bound of the OA group can reach 90 dB and occur consistently in the last three movement phases (see Fig. 4b-4d) compared with the maximum around 75 dB for the healthy group occurring in the descending movement phase (see Fig. 4c, 4d);
- the highest upper bound of the health group in the ascending phase is at least 10 dB lower (see Fig. 4a, 4b) than that in the descending phase (see Fig. 4c, 4d);
- the largest difference between the upper bounds of the two groups is 30 dB and occurs in the AD movement phase (see Fig. 4d).
- the smallest difference between the upper bounds of the two groups is 10 dB and occurs in the AA movement phase (see Fig. 4a).
From the ASL based probability distributions shown in Fig. (4), it is seen that
- the upper bounds of the OA group in all the movement phases are again consistently higher than those of the healthy group and are around 50 dB;
- the highest upper bound of the healthy group in the descending phase is at least 5 dB lower that that in the ascending phase at around 40 dB;
- the upper bound difference between the two groups is larger in the descending phase.
These observations indicate not only significant statistical differences based on AE peak magnitude and ASL values between the healthy and OA knees with the latter group generating considerable higher AE energies, but also highlight the relative importance of the peak magnitude feature in the AD movement phase for differentiation of healthy and OA knees.
4. VISUAL PRESENTATION AND PRINCIPAL COMPONENT ANALYSIS
With the peak magnitude and ASL values of AE hits providing statistical differences between healthy and OA knees as shown in the previous section, an AE hit waveform detected in the ith sit-stand-sit movement can be represented by Wi(peak, ASL, p), where peak and ASL denote the values of the two AE features, and p denotes the four movement phases of AA, AD, DA, and DD, respectively. If the range of peak and ASL is divided into U and V intervals, then the descriptor of each AE hit waveform becomes Wi(peakj, ASLk, p), where j = 1, 2, …, U and k = 1, 2, …, V yielding a total of U x V possible feature classes. For a set of M repeated sit-stand-sit movements by a person, an AE feature profile of the person can be constructed based on the average number of AE hit waveforms for each possible feature class in each movement phase, denoted by  (peakj, ASLk, p).
To enable rapid visualisation of the differences between healthy and OA knees based on the AE feature profile, the AE feature profile of a knee based on  peakj, ASLk, p) is shown as an image based visual display, whereby the average numbers of AE hits for each feature class in each movement phase is shown in each quarter of the image as a 2D colour histogram with its two axes corresponding to peakj and ASLk. Two examples of the image based visual display are shown in Fig. (5) for two different AE feature profiles with one corresponding to a healthy knee and the other corresponding to an OA knee. They are produced based on the AE peak magnitude and ASL values acquired over 10 repeated sit-stand-sit movements and falling in 7 peak magnitude intervals and in 9 ASL intervals. While the first six peak magnitude intervals are given by
 |
(1) |
and the last peak magnitude interval is given by peak7 > 90 dB, the first eight ASL intervals are given by
 |
(2) |
and the last ASL interval is given by ASL9 > 50 dB. As shown in Fig. (5), AE hits shown in the left half and the right half of each image based visual display occur during the ascending and descending phases, whereas AE hits shown in the top half and the bottom half occur during the acceleration and deceleration phases. To enable visualisation of pattern symmetry, the directions of increasing peakj and ASLk are oriented outwards from the centre. It can be quickly grasped from Fig. (5) that the healthy joint generates a small number of AE hits of lower peak magnitude and ASL values, whereas the OA joint generates a large number of AE hits with a wide range of peak magnitude and ASL values.
The image based visual display of the joint AE profile provides also a uniform data format for application of conventional multivariate data analysis techniques, such as principal component analysis (PCA) [17], to highlight the differences of AE patterns between healthy and OA knees in the same age group. PCA is a powerful method which aids in the reduction of data from the initial measurement, by projecting the data on a different basis, thereby reducing the dimensionality for visualisation, comparison and classification.
Let the image based visual display of the joint AE profile be represented by a matrix with each entry containing the average number of AE hits in each feature class. Concatenation of each row in the matrix forms a vector of the joint AE profile. If xi and yj represent the resulting vectors of the ith healthy knee and the jth OA knee, then the healthy and OA groups can be represented by two matrices, H = [… xi …]T and OA = [… yi …]T, respectively. Merging the healthy and OA groups into a matrix gives
 |
(3) |
and its covariance matrix can be computed from
 |
(4) |
where µM is the matrix of means of each column (feature class) in M. Applying PCA to the covariance matrix to obtain its eigenvectors denoted by V and eigenvalues denoted by λi, the AE features can be represented in a different domain using eigenvectors as new basis vectors, i.e.
 |
(5) |
By selecting a small number of eigenvectors associated with highest eigenvalues (called principal components), it enables visualisation of the projected AE features in a lower dimension and reveals the most significant pattern with largest variations.
For the two age matched healthy and OA groups, Fig. (6) shows the projection of the AE features using the first three principal components capturing approximately 80.77% of the total variance in the data, where OA knees are marked by x with OA and age and healthy knees are marked by* with H and age. From Fig. (6), it is seen that the two groups of knee joints form two well separated clusters without any overlapping. The group of healthy knees is very dense with small distances between subjects, whereas the group of OA knees are more scattered with longer distances between them. This suggests the possibility of further group clustering to define sub-domains based on different pathologies for OA patients. This also suggests the possibility of using PCA as a basis for the evaluation of the condition of OA knee joint by using their distance and position with respect to a reference point defined by the clinically normal group.
It may be noteworthy to mention that the sensitivity of PCA to the change of the peak magnitude and ASL intervals, or “granularity”, was investigated. Although using a different granularity will give a different result, the general pattern of the positions of each point in the space formed by the first three principal components was relatively robust with the separation between the two groups preserved.
5. CONCLUSIONS
This paper presents a study of the same age group consisting of healthy and OA knee joints in terms of the AE produced during repeated sit-stand-sit movements. Using a four-phase model of the sit-stand-sit movement and a two feature descriptor of the AE signals, quantitative and qualitative statistical analysis of the AE signals shows that OA knees produce consistently and substantially more AE events with higher peak magnitude and ASL values than healthy knees. Furthermore, the ascending-deceleration phase of the sit-stand-sit movement was seen to produce the largest difference between the two groups. To enable rapid visualisation of the AE feature profile of a knee based on the four-phase movement model and two-feature descriptor, an image based visual display was created based on a combination of multiple 2D colour histograms, and this image based visual display provides also a uniform data format for PCA. In the space formed by the first three principal components, it is seen that the proposed four-phase movement model and two-feature descriptor produces two separated clusters corresponding to two different knee conditions even though they are in the same age group. Although the presented results are based on a small number of subjects in two groups, they demonstrate the excellent sensitivity performance of the proposed analysis method for differentiation of healthy and OA knees. Furthermore, by using the cluster area of the healthy group in the PCA space as a reference, identification of clinical subgroups for knee joints could be made possible for more effective treatment. For example, the high risk subgroup for OA could be identified as having the PCA projections of their knee AE profiles near to but within the healthy cluster boundary, thereby enabling introduction of more frequent monitoring and preventive measures; and the early OA subgroup as having the PCA projections of their knee AE profiles near to but outside the healthy cluster boundary, thereby triggering the start of a more effective treatment in the early stage. All of these provide a strong base for further work to develop joint angle based AE as a new measurement tool that can be conveniently used in clinic and home settings for activity based assessment of the knee joint conditions.
ACKNOWLEDGEMENTS
The work was supported by the Arthritis Research Campaign (Grant Ref. No. 17542) and we thank the people participating in the study and Dr. B. Mascaro for the technical input.


